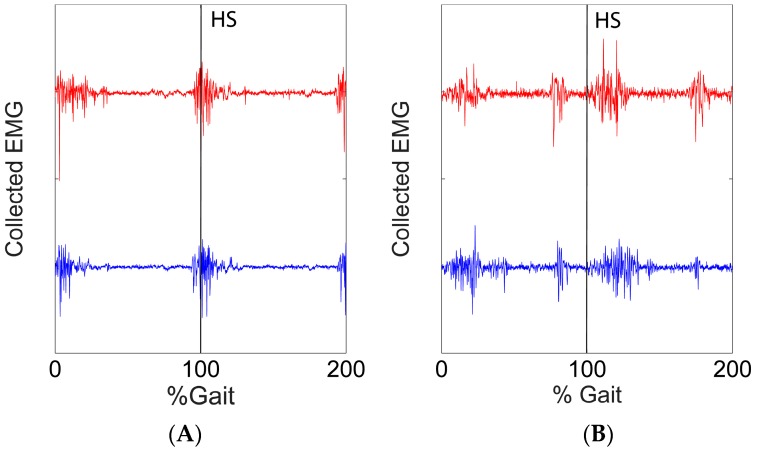
Figure 9.
Comparison of raw EMG signals from two channels (Channel (A) BFL and Channel (B) RF) at the training session and at the final test session (adaptive #10). The EMG signals were collected in two gait cycles at level ground walking. The red line showed the EMG at the training session and the blue line showed the EMG at the final test sessions. The vertical lines indicated heel strike (HS).

