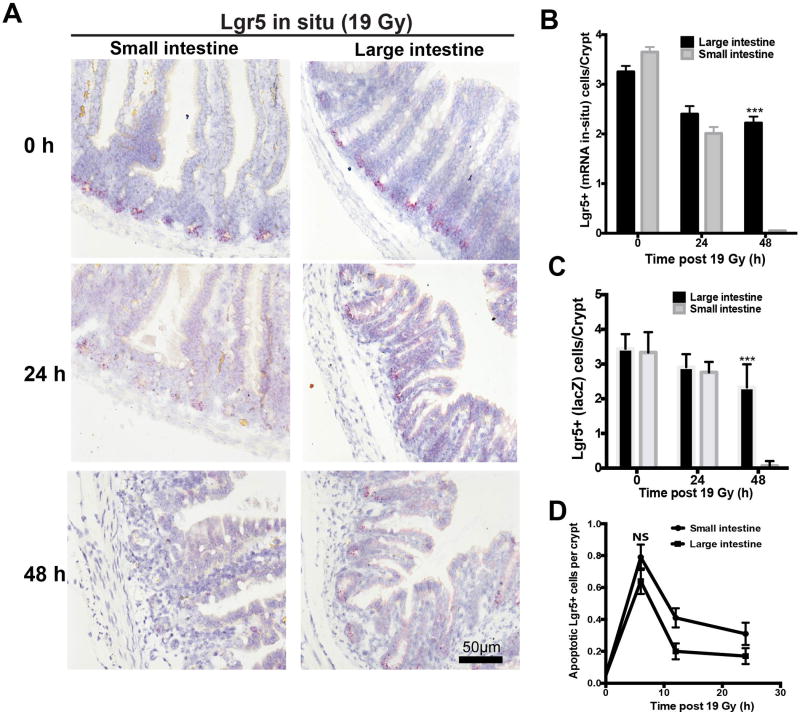
Figure 4. Kinetic analysis of ISC loss.
(A) Representative Lgr5 ISH staining of intestines from Lgr5-lacZ mice treated with 19 Gy at day 0, 1 and 2. All images are of the same magnification; scale bar = 50 µm. (B) Quantitative comparison of Lgr5+ ISC depletion, detected by ISH, in the intestines of Lgr5-lacZ transgenic mice after 19 Gy irradiation. Bars represent mean ± standard error (n=100 crypts from 4 mice). ***p<0.001. (C) Loss of Lgr5+ ISCs was confirmed by LacZ staining. Numbers of Lgr5+ positive cells per crypt were quantified from 6 mice/time point, evaluating 50 crypts/mouse. ***p<0.001. (D) Evaluation of apoptotic cell death in ISCs using Lgr5 ISH and caspase3 double staining after 19 Gy irradiation. Bars represent mean ± standard error (n=100 crypts from 4 mice). NS, not significant.

