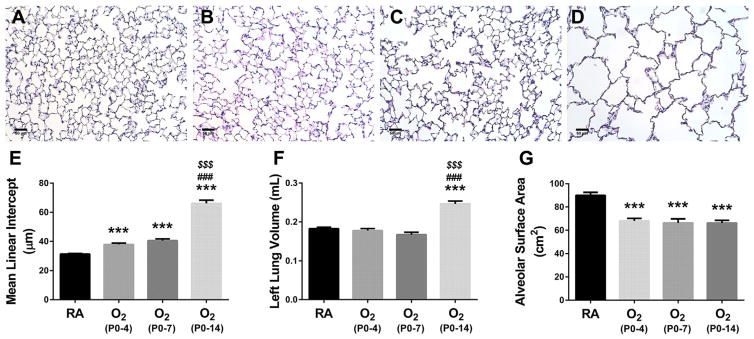
Fig. 2.
Development of Alveolar surface area following neonatal hyperoxia. (A–D) Representative hematoxylin/eosin stained lung sections at 2 months of age in animals continuously raised in (A) RA, or initially exposed to neonatal hyperoxia (≥90% O2) from (B) P0-4, (C) P0-7, or (D) P0-14, followed by recovery in RA. Assessment of (E) mean linear intercept (MLI), (F) left lung volume by water displacement, and (G) alveolar surface area. Original images obtained with 20× objective. Scale bar = 50μm. Values are expressed as means±SEM. ***P < 0.001 versus RA, ###P < 0.001 versus O2 P0-4, $$$P < 0.001 versus O2 P0-7) by one way ANOVA using Tukey’s multiple comparison post-test analysis. Results are representative of three independent experiments. n = 19 (RA), 10 (O2 P0-P4), 12 (O2 P0-P7), 9 (O2 P0-P14).

