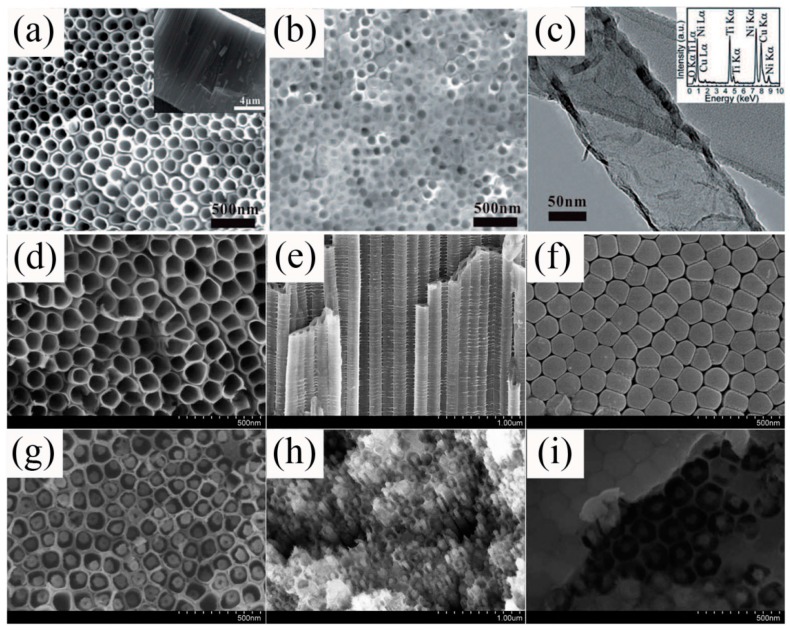
Figure 4.
(a–c) SEM images of (a) TiO2 NTAs and (b) hydrothermally treated TiO2 NTAs; (c) TEM image of a typical NiTiO3/TiO2 NTs, the inset is the corresponding energy dispersive spectrometer (EDS) spectrum [79]. Copyright 2015 Wiley. (d–i) SEM images of as-anodized TiO2 NTs (d–f) and TiO2 NTs filled by Co-precursor nanorods (g–i) in top view(d,g), cross-sectional view (e,h), and bottom view (f,i) [80]. Copyright 2013 Royal Society of Chemistry.

