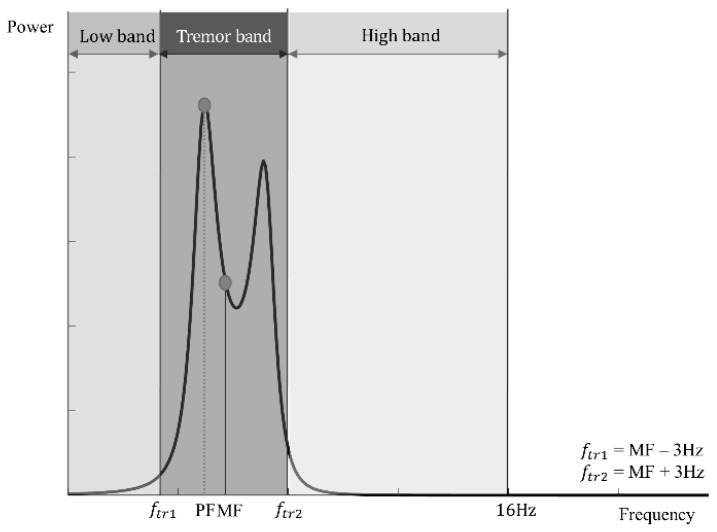
Figure 4.
Graphically intuitive representation of the three frequency bands and spectral features in an averaged spectrum. The peak frequency (PF) and mean frequency (MF) are represented as an example. On the basis of the MF, the tremor frequency band is separated first; then, the remaining low- and high-frequency bands are determined.

