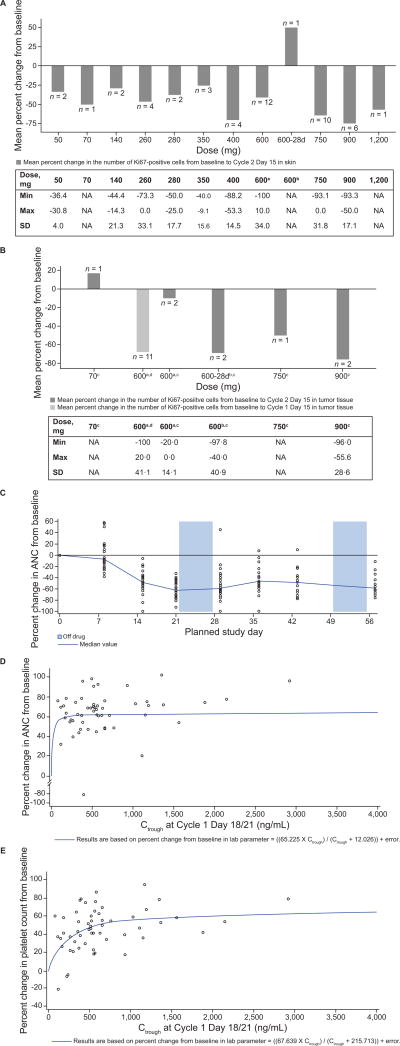
Figure 2. Ribociclib pharmacodynamics.
(A, B) Mean percentage inhibition of Ki67 in (A) skin and (B) tumor vs. ribociclib dose. Tables provide the minimum and maximum percent change in Ki67 from baseline for each dose group, plus the SD for the mean percent change in Ki67 from baseline. (C) ANC over time (two cycles of ribociclib treatment) in the 600 mg/day ribociclib 3-weeks-on/1-week-off dose group (restricted to patients with a Cycle 1 duration of 28 days or less; n = 31). (D) Absolute neutrophil count by exposure (Ctrough Day 21). (E) Platelet count by exposure (Ctrough Day 21). The relation between the Ctrough and changes in (D) absolute neutrophil count and (E) platelet count were described by the equation:
Data cut-off: April 24, 2014.
Abbreviations: 28d, 28-day continuous dosing schedule; ANC, absolute neutrophil count; C, cycle; Ctrough, trough plasma concentration; D, day; NA, not applicable; SD, standard deviation.
a3-weeks-on/1-week-off schedule. bContinuous dosing schedule. cPost-baseline tumor samples collected at Cycle 2 Day 15. dPost-baseline tumor samples collected at Cycle 1 Day 15.

