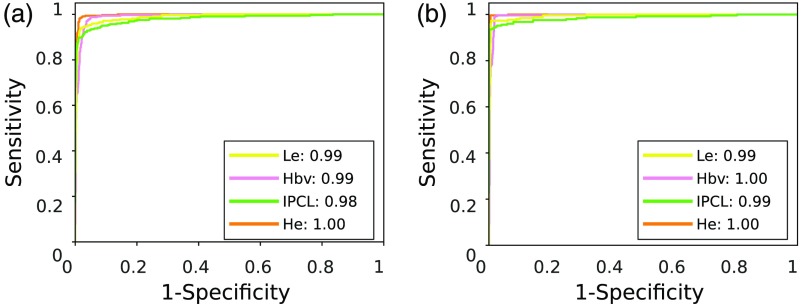
Fig. 8.
ROC curves at different level of confidence on classification. Each curve refers to one of the laryngeal tissue classes. He, healthy tissue; Hbv, tissue with hypertrophic vessels; Le, leukoplakia; and IPCL, tissue with IPCL-like vessels. The area under the ROC curve, for each curve, is reported in the legend. Classification is obtained using LBP and first-order statistics with SVM. (a) ROC curves for . (b) ROC curves for .

