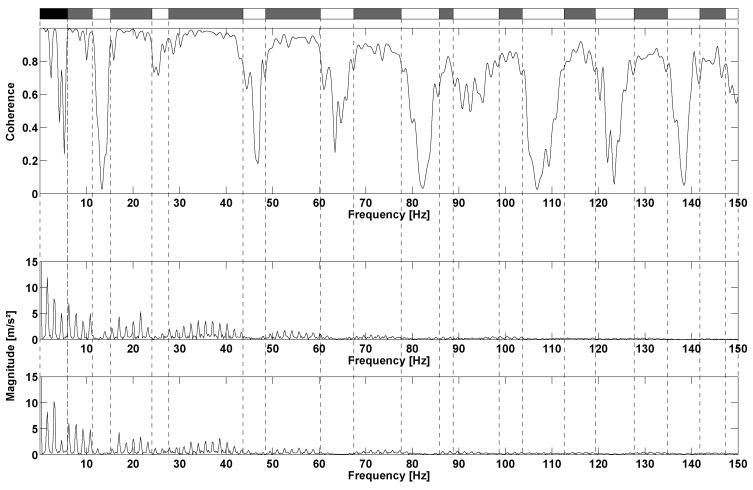
Figure 8.
Spectral coherence between R and H at : coherence (top), H spectrum (middle) and R spectrum (bottom). The black area is the frequency range presenting the stride frequency and first harmonics, white areas are lesser energy ranges and grey areas symbolize the IMUA response to excitation frequencies.

