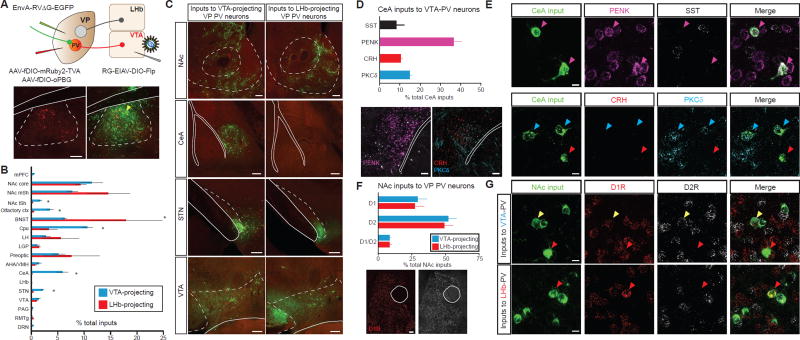
Figure 2. Input-output mapping reveals anatomically and molecularly distinct inputs of PVVP→LHb and PVVP→VTA neurons.
(A) Injection regiment to map pseudotype rabies-mediated monosynaptic inputs to either LHb-projecting or VTA-projecting VP PV neurons (top). Starter cell localization of AAV-fDIO-mRuby2-TVA, AAV-fDIO-oPBG, and EnvA-RVΔG-eGFP (bottom, yellow arrows). Scale: 200 µm.
(B) Whole-brain quantitation of inputs to PVVP→LHb and PVVP→VTA neurons. Data presented as mean ± SEM, percentage of total cells in a given brain area relative to total number of brain-wide inputs. Unpaired t-tests used for individual brain regions, * P < .05, ** P < .01, n = 4 for each condition.
(C) Representative images of inputs in select brain areas. Scale bars: 200 µm.
(D) Molecular characterization of CeA inputs to PVVP→VTA neurons via FISH assay. Quantitation (top) and representative images of mRNA labelling (bottom). n = 257 cells from 2 animals. Scale: 100 µm.
(E) Images of CeA neurons sending input to PVVP→VTA neurons with cell-type specific markers. Colored arrows represent colocalization between rabies+ input cells and mRNA for specified probe. Scale: 10 µm.
(F) Quantitation of NAc D1R- and D2R-expressing MSN inputs to PVVP→LHb and PVVP→VTA neurons. Scale: 100 µm.
(G) Representative images in NAc showing colocalization of D1R or D2R in neurons projecting to PVVP→LHb and PVVP→VTA neurons. Red arrows denote D1R colocalization, white arrows D2R, yellow arrows co-express D1R and D2R. N = 1505 cells from 2 animals each. Scale: 10 µm.
mPFC, medial prefrontal cortext; BNST, bed nucleus stria terminalis; LH, lateral hypothalamus; LGP, lateral globus pallidus; AHA/VMH, anterior hypothalamic area/ventromedial hypothalamus; PAG, periaqueductal grey; RMTg, rostromedial tegmental nucleus; DRN, dorsal raphe nucleus. SST, somatostatin; PENK, preproenkephalin; CRH, corticotropin releasing hormone; PKCδ, protein kinase C delta.

