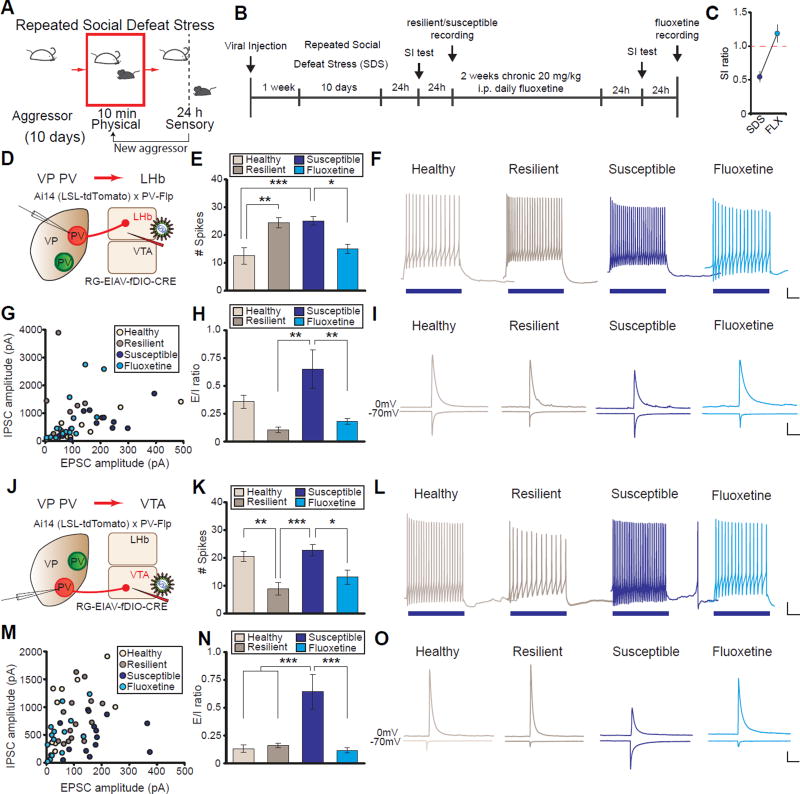
Figure 3. PVVP→LHb and PVVP→VTA neurons from susceptible animals exhibit distinct electrophysiological adaptations to SDS and can be reversed by chronic fluoxetine.
(A and B) Behavioral paradigm and experimental timeline of repeated chronic social defeat stress (SDS) experiments.
(C) Chronic fluoxetine (FLX) treatment ameliorates SDS-induced social withdrawal. Red line indicates bound between susceptible (< 1) and resilient animals (> 1).
(D) Schematic for labeling PVVP→LHb neurons in acute slices.
(E and F) Spikes elicited after 100 pA current injection in PVVP→LHb neurons. One-way ANOVA F3,34 = 9.088, P < .001. Tukey post-test; *** P < .001, ** P < .01, * P < .05; n = 9, 11, 10, 8 cells from 4 animals each in control, resilient, susceptible, and FLX groups, respectively. Example traces in (F), blue bars represent duration of current injection (500 ms). For full responses see Fig S7A.
(G–I) Evoked excitatory and inhibitory inputs (E/I) onto PVVP→LHb neurons in healthy and SDS groups. Absolute amplitudes (G), ratio of E/I inputs (E/I ratio; H), and example traces (I) of cells recorded. One-way ANOVA F3,42 = 5.499, P < .01; Tukey post-test: ** P < .01; n = 8, 9, 13, 16 cells from 5 animals each in control, resilient, susceptible, FLX groups, respectively.
(J) Schematic for labeling PVVP→VTA neurons in acute slices.
(K–L) Same as in (E and F), but PVVP→VTA neurons. One-way ANOVA F3,36 = 8.770, P < .001. Tukey post-test; *** P < .001, ** P < .01, * P < .05; n = 12, 10, 10, 8 cells from 7, 4, 4, and 3 animals in control, resilient, susceptible, and FLX groups, respectively. For full responses see Fig S7B.
(M–O) PVVP→VTA neurons have a significant increase in E/I ratio in susceptible animals that is normalized by FLX. Absolute amplitudes (M), E/I ratio quantitation (N), and example traces (N).
One-way ANOVA F3,50 = 9.585, P < .001; n = 11, 15, 13, 15 cells from 5 animals each in control, resilient, susceptible, FLX groups, respectively. Tukey post-test: *** P < .001.
Scale for (F and L): 100 ms, 10 mV; (I and O): 200 pA, 100 ms. Data presented as average mean ± SEM.

