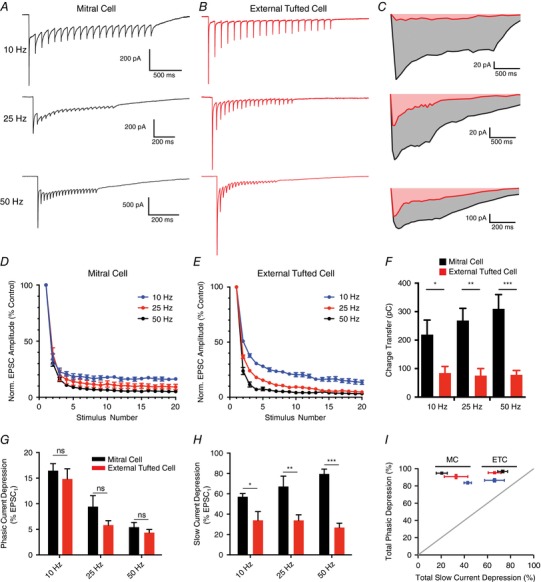
Figure 5. Differential modulation of phasic and slow currents in mitral and external tufted cells.

A and B, whole‐cell voltage clamp responses of mitral cells (A) and external tufted cells (B) to stimulation at various frequencies (10, 25, 50 Hz). C, comparison of the slow, envelope current measured in mitral cells and external tufted cells at each stimulus frequency. Mitral cells had consistently larger envelope currents. D, depression of the phasic EPSC amplitude as a function of stimulus number in mitral cells across stimulation frequencies (10 Hz, 25 Hz, 50 Hz). E, depression of phasic EPSC amplitude as a function of stimulus number in external tufted cells. F, the total charge transfer (measured 2.5 s after stimulus onset) was significantly larger in mitral cells than external tufted cells across all stimulation frequencies. There was no significant difference across stimulus frequencies within either cell type. G, total phasic depression in mitral cells and external tufted cells across stimulation frequencies. There was no significant difference between cell types at any frequency tested. H, total slow current depression in mitral cells and external tufted cells across stimulation frequencies. Mitral cells had significantly less slow current depression at all stimulus frequencies tested. I, plot showing a direct comparison of phasic depression and tonic depression across cell types and frequencies (10 Hz, 25 Hz, 50 Hz). Although the phasic depression was similar between cell types and frequencies, the slow current was differentially regulated in mitral cells and external tufted cells. [Color figure can be viewed at wileyonlinelibrary.com]
