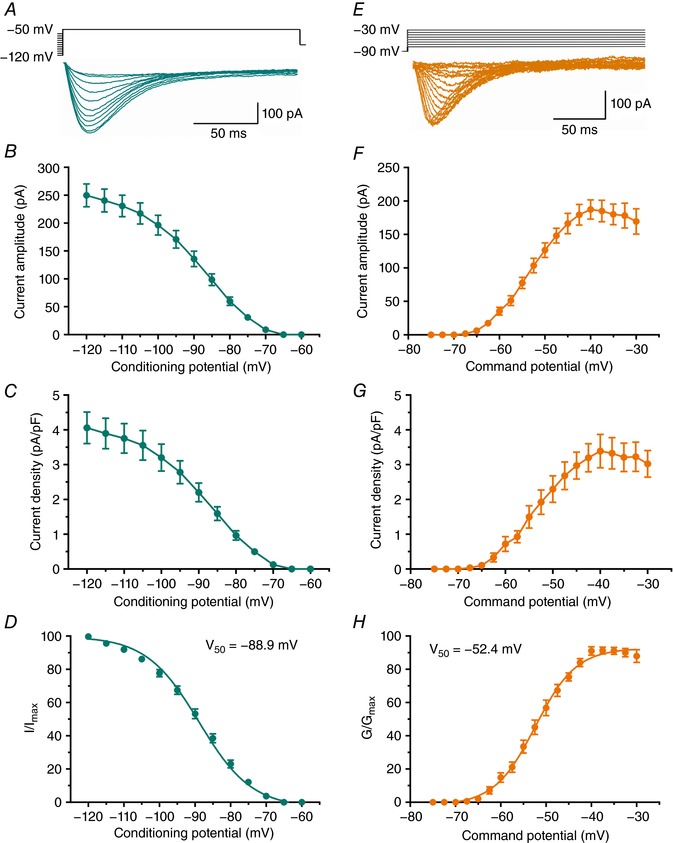
Figure 1. Biophysical properties of T‐currents in the rat subiculum.

A, averaged T‐current traces from representative subicular neurons generated using a double‐pulse protocol with 3.6‐s‐long prepulses to variable voltages (from −120 to −60 mV in 5 mV increments) and test potential (V t) of −50 mV. B, average current amplitudes over the range of potentials obtained from the steady‐state inactivation protocol. C, average current density, as calculated from the steady‐state inactivation protocol. D, the average steady‐state inactivation (I/I max) curve with V 50 value noted on the graph. E, averaged T‐current I–V traces from representative subicular neurons in the voltage range of V t from −75 to −40 mV from V h of −90 mV in 2.5 mV increments. F, average current amplitudes from multiple I–V curves. G, average current density, as calculated from the I–V curves. H, the average voltage dependence of steady‐state activation (G/G max) curve with V 50 value noted on the graph.
