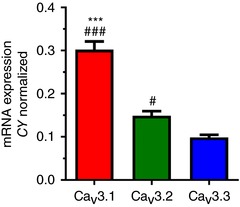
Figure 3. Dominant expression of CaV3.1 isoform of T‐channel in the rat subiculum.

Bar graph with qRT–PCR analysis on excised subicular tissue revealed the dominant expression of CaV3.1 isoform of T‐channels (*** P < 0.001 vs. CaV3.2, # P < 0.05 and ### P < 0.001 vs. CaV3.3 isoform, Tukey's post hoc test).
