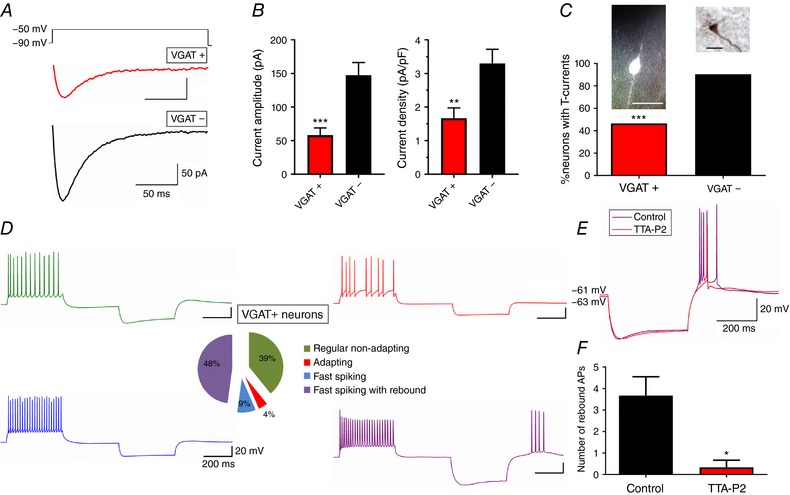
Figure 4. Properties of T‐currents in subicular GABAergic interneurons and their classification.

A, average original T‐current traces from representative VGAT+ (red) and VGAT– (black) neurons, generated using a double‐pulse protocol with 3.6‐s‐long prepulses to −90 mV and test potential of −50 mV. B, GABA interneurons (VGAT+) have smaller T‐current amplitudes and density compared to pyramidal neurons (VGAT–). (* P < 0.05, ** P < 0.01 and *** P < 0.001, Tukey's post hoc test) C, relative percentages of VGAT+ and VGAT– neurons with detectable T‐currents accompanied by fluorescently labelled VGAT+ interneuron (left), and biocytin labelled VGAT– pyramidal neuron (right) determined morphologically. Scale bars: 10 μm. (*** P < 0.001, Fisher's exact test) D, classification of identified VGAT‐labelled neurons according to their firing patterns, with largest constituent being fast‐spiking with rebound (48%, purple trace). E, original traces of VGAT+ neuron characterized as fast‐spiking with rebound before (purple) and after the application of 10 μm TTA‐P2 (red). F, number of rebound action potentials before (Control) and after TTA‐P2. (* P < 0.05, two‐tailed paired t test).
