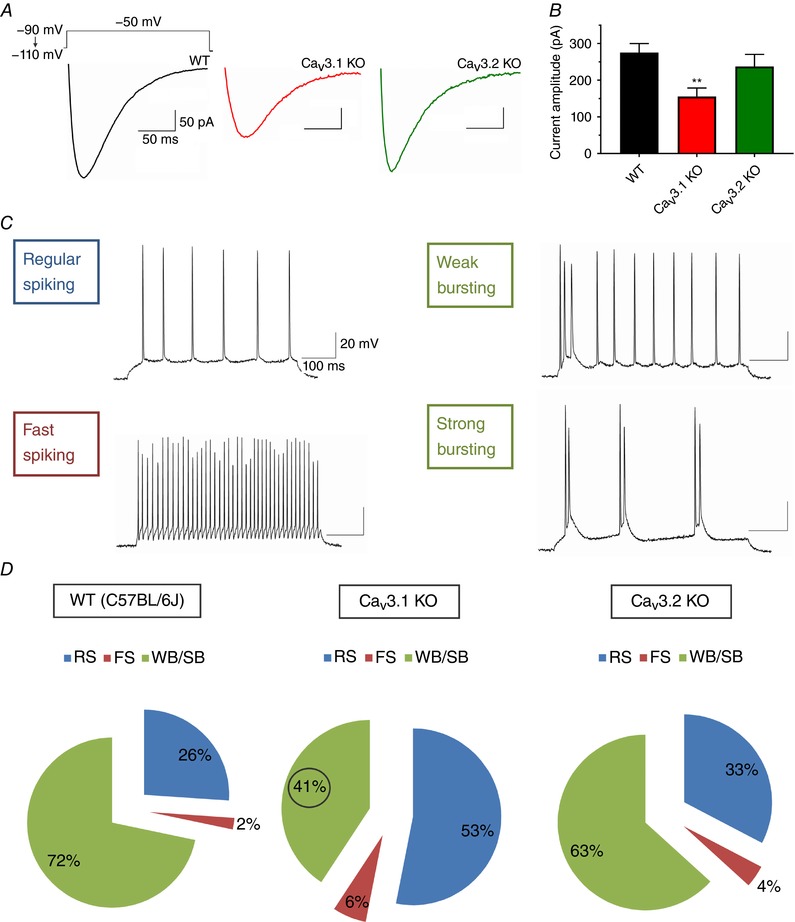
Figure 7. Decreased T‐current densities and bursting in the subiculum of CaV3.1 KO mice.

A, representative averaged original traces of subicular T‐currents from WT mice (black line), CaV3.1 KO mice (red line) and CaV3.2 KO mice (green line). B, bar graphs represent averaged current amplitudes after −110 mV prepulse during the steady‐state inactivation protocols in three cohorts as depicted in panel A of this figure. Note that average current amplitudes are significantly decreased only in CaV3.1 KO mice when compared to WT mice. C, original traces from representative of the four spike firing patterns identified in the WT mouse subiculum as a response to a 500‐ms depolarizing current injection. D, pie charts representing the percentages of different firing patterns of subicular neurons in C57BL/6J, CaV3.1 KO and CaV3.2 KO mice: RS, regular‐spiking; FS, fast‐spiking; WB, weak bursting; SB, strong bursting; total n = 222 neurons. Note the smaller portion of burst firing neurons and larger portion of regular spiking neurons in CaV3.1 KO mice when compared to C57BL/6J WT mice.
