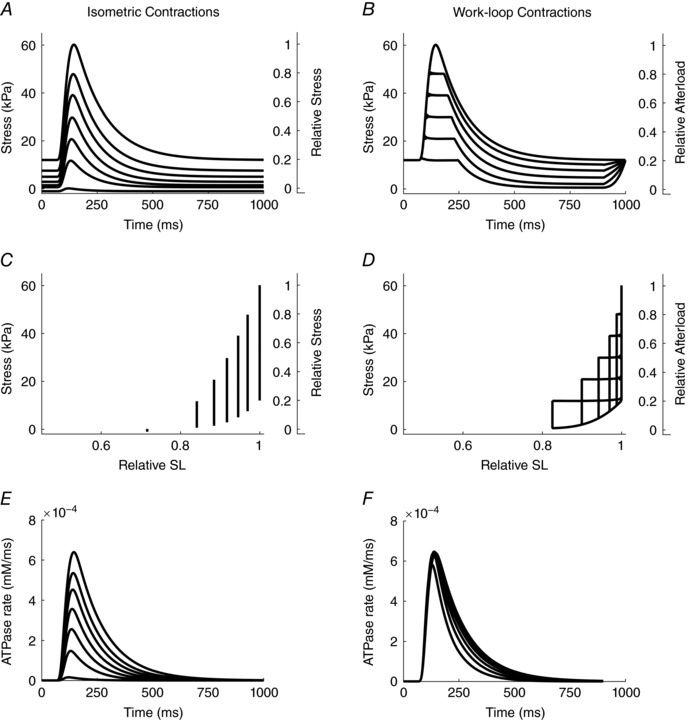
Figure 3. Simulated twitches arising from isometric and work‐loop contractions.

For both twitch protocols, initial sarcomere length is 2.3 μm. A, superimposed isometric contractions commencing at the six relative sarcomere lengths shown in C. B, work‐loop twitches at afterloads chosen to match the peaks of the isometric twitches shown in A. D, work‐loops derived from the temporal profiles shown in B. E and F, simulated time‐dependent rates of ATP hydrolysis by cross‐bridges during isometric twitches (E) and afterloaded isotonic twitches (F). In panels A–D, note re‐casting (right‐hand ordinates) of stress as relative stress for isometric contractions, and relative afterload for work‐loop contractions.
