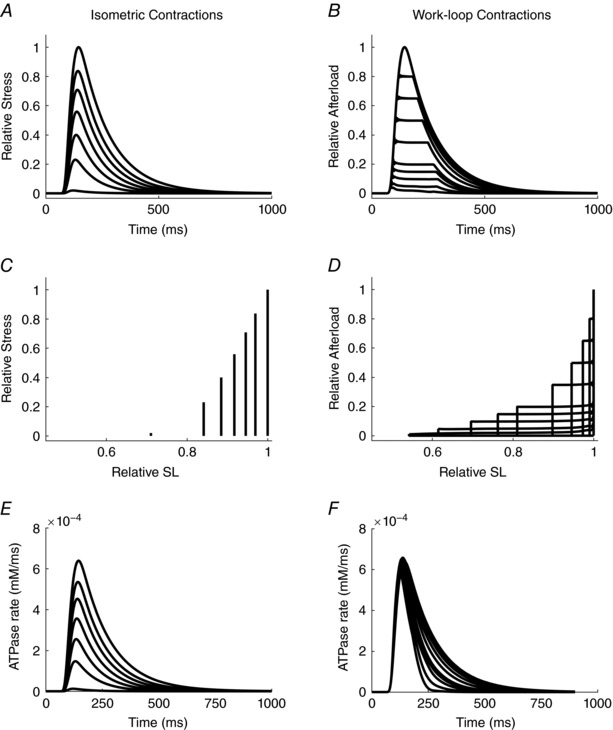
Figure 5. Simulated profiles of twitches and stress versus relative sarcomere length, and rates of cross‐bridge ATP hydrolysis arising from isometric and isotonic contractions in the absence of passive force.

Each panel shows output equivalent to that in the corresponding panels of Fig. 3.
