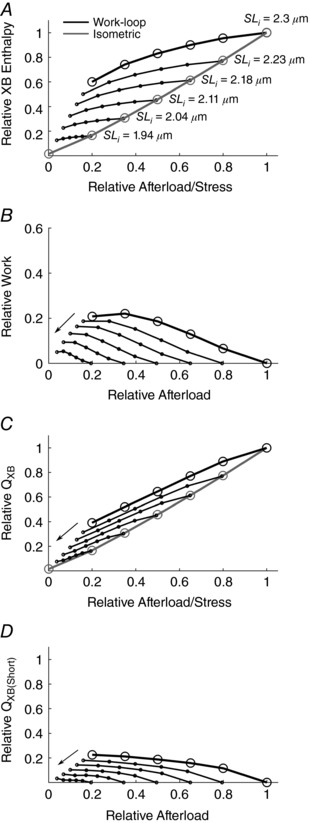
Figure 8. Simulated energetics of isometric (grey line) and work‐loop contractions (black line) commencing at the initial sarcomere lengths specified.

As in Figs 4 and 6, in each panel the black circles and thick black lines denote a range of work‐loop contractions commencing at optimal length (2.3 μm), and the grey circles and grey lines denote isometric contractions producing the same values of peak twitch force. The thin black lines joining the dots represent work‐loops commencing at progressively diminishing sarcomere lengths (as indicated by the labels in A and the arrows in B–D).
