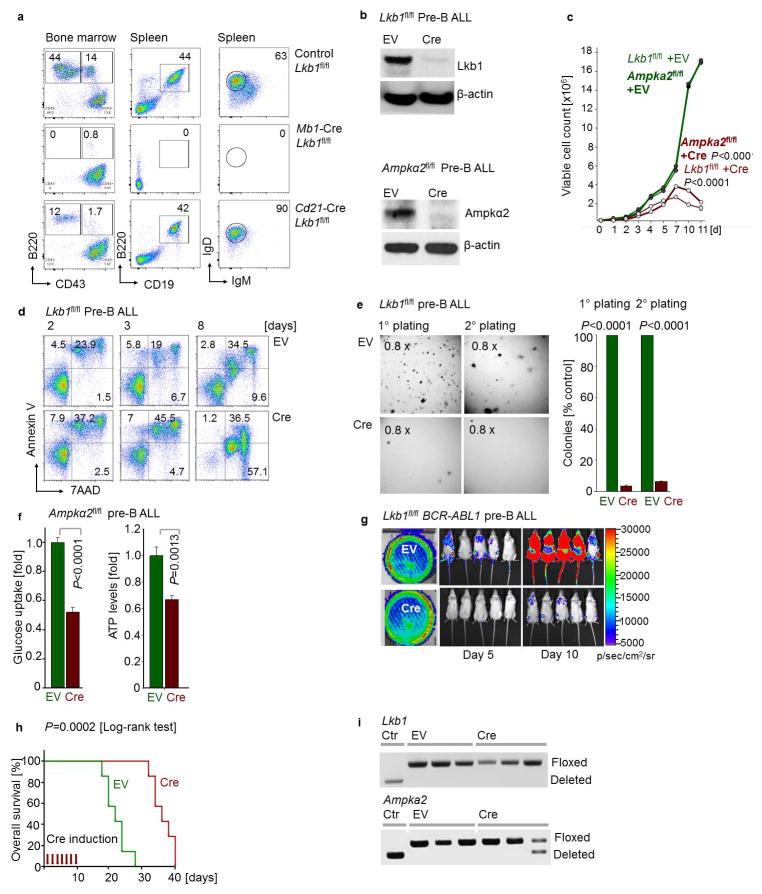
Extended Data Figure 4. The energy stress sensor LKB1-AMPK plays a pro-survival role and modulates glucose uptake and energy supply in pre-B ALL.
a, Lkb1fl/fl mice were crossed with Cre deleter strains for deletion at early pre-B cell stages (Mb1) and in fully mature B cells (Cd21). B cell populations in bone marrow and spleen (n = 3 litter mates) were characterized by flow cytometry analysis. b, The catalytic subunit of AMPK has two isoforms – α1 and α2. Analysis of published gene expression data (GSE38463)39 revealed that expression of the α1-form peaks at later stages of B cell development, whereas expression levels of both Lkb1 and the α2-form of Ampk peak in pre-B cells. For this reason, we studied here the consequences of inducible ablation of Lkb1 and Ampkα2 in murine models for BCR-ABL1-transformed pre-B ALL cells. Protein levels of Lkb1 and Ampkα2 were verified by Western blots. c, Viable cell counts upon Cre-mediated deletion of Lkb1 or Ampkα2. d, Apoptosis following Lkb1 deletion was monitored by Annexin V/7AAD staining. e, Colony forming ability was assessed by serial replating upon deletion of Lkb1 in pre-B ALL cells. f, Glucose uptake and ATP levels (normalized to cell numbers) were measured following Cre-mediated deletion of Ampka2. g, Luciferase bioimaging of transplant recipient mice injected with Lkb1fl/fl pre-B ALL cells transduced with 4-OHT-inducible Cre or EV and treated with Tam (0.4 mg/mouse; n = 7 per group). h, Overall survival was assessed by a Kaplan-Meier analysis (P-value calculated by Mantel-Cox log-rank test). i, Leukemia samples developed in recipient mice (Fig. 2d) were genotyped for the presence of either floxed or deleted Lkb1 and Ampka2 alleles (n = 3 mice). Representative FACS plots and images from 3 independent experiments are shown (a, d, e). Data shown as mean from 3 independent experiments (± s.d.) and assessed by two-way ANOVA (c) or two-tailed t-test (e, f). For gel source data, see Supplementary Fig. 1.

