
Figure 2.
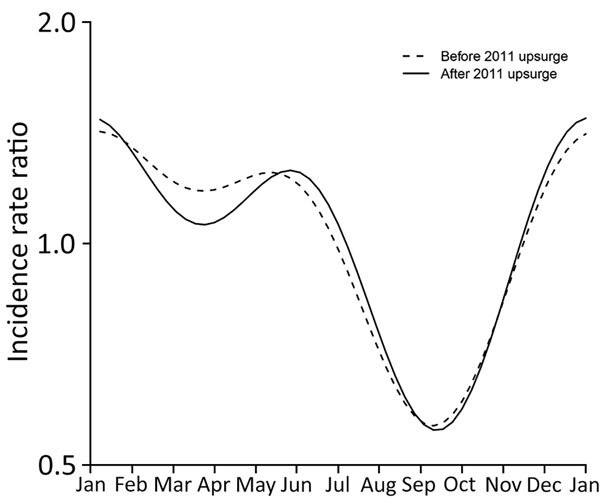
Estimated incidence rate ratios of the seasonal component from the negative binomial regression models before and after the 2011 upsurge of scarlet fever, Hong Kong. Both curves show a bimodal pattern with peak incidence during December–January and May–June and lowest incidence in September.