
Figure 1.
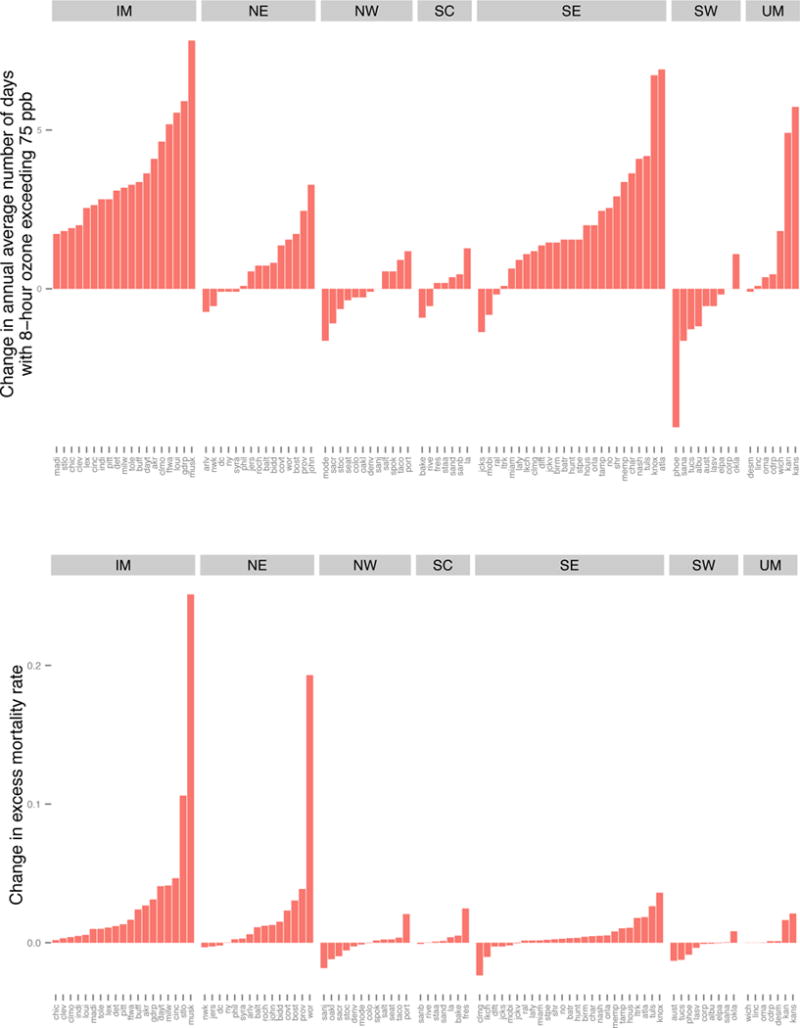
For each city and within each region, the change in mean number of days with 8-hour ozone exceeding 75 ppb (top) and the change in excess mortality rate per 100,000 persons (bottom). The city codes and regions follow Samet et al. (2000a,b).