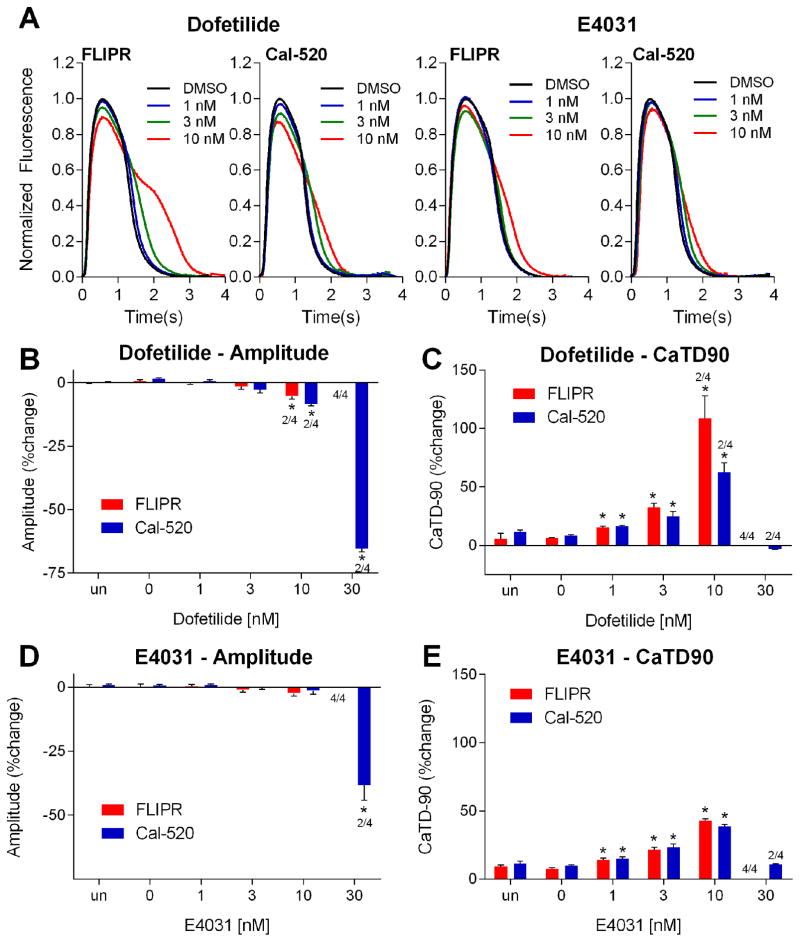
Figure 2.
Analysis of CaT profiles drug-treated iPSC-derived cardiomyocytes measured using FLIPR and Cal-520 calcium dye. FLIPR and Cal-520 loaded iPSC-derived cardiomyocytes treated with increasing concentrations of dofetilide and E4031 and analysis of (A) average traces, (B) and (D) amplitude, (C) and (E) CaT duration-90. Asterix (*) indicates a significant difference (P<0.05) from vehicle-treated groups by t-test analysis and a number above the bar indicates the fraction of the total number of wells where traces showed EAD and were not included in the analysis. Percent changes were computed by 100 X (Treated Read3-Pretreated Read2)/(Pretreated Read2) for each well. There was no significant difference between no treatment and vehicle treated groups.

