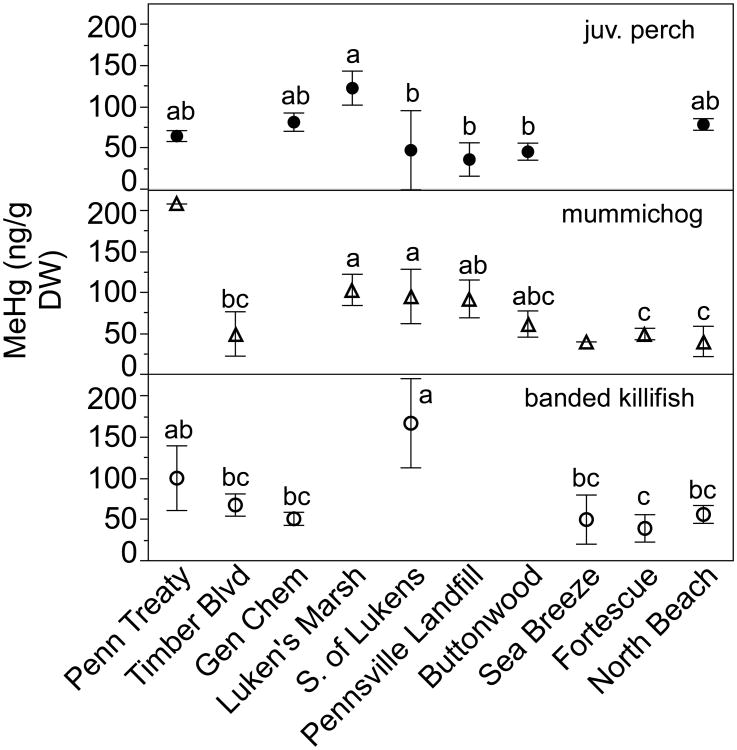
Fig. 4.
Mean +/- st. dev. of MeHg tissue concentration (ng/g DW) in small fish. Different letters indicate significant differences as indicated by Tukey's HSD. Mummichog n=3-7 per site except for PT and SB where n=1. Juvenile perch n=3 per site except BW where n=2. Banded killifish n=3-7 per site except LM where n=1.

