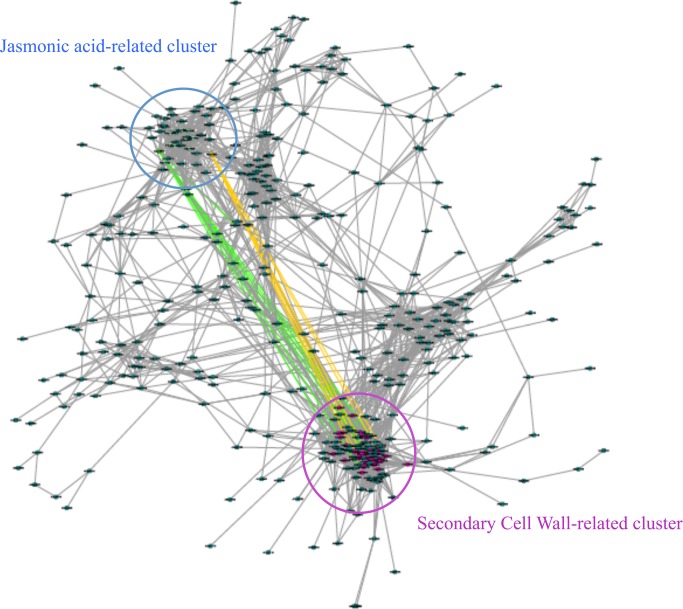
Fig 2. Gene coexpression network made from genes up-regulated in mur1-1 stems.
An edge weighted, force-directed approach was used, based on data retrieved from ATTED-II and visualised in Cytoscape 2.8 (http://www.cytoscape.org). In this network, each gene is represented by a node and each grey edge connecting two nodes represents a mutual rank <100. Two modules of high density were revealed suggesting a tight coexpression. Green and orange edges link MYB73 and DDP1 respectively to secondary cell wall genes potentially regulated by these transcription factors (Taylor-Teeples et al., 2014).

