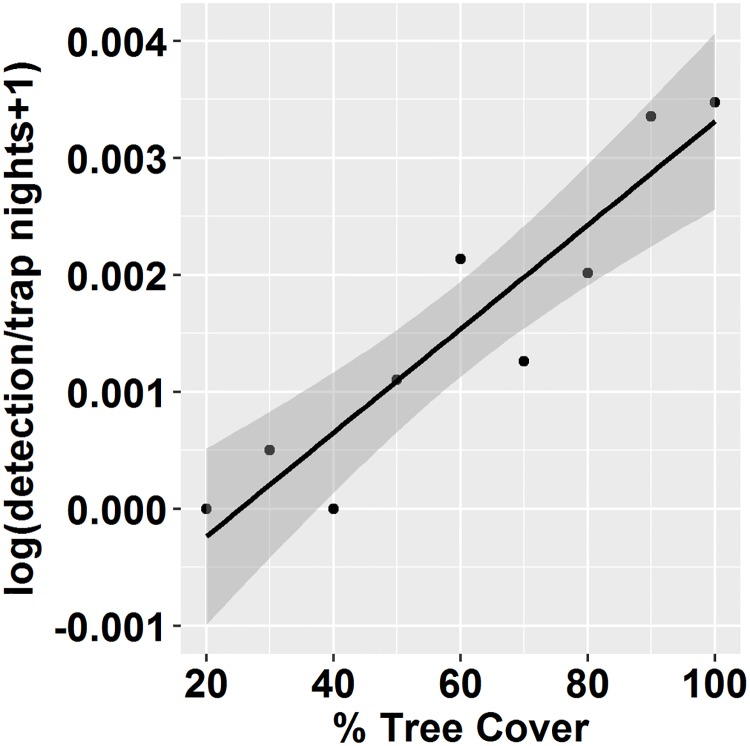
Fig 2. The log-linear relationship between sun bear detection rates at camera traps and % tree cover.
We pooled data from camera traps active between 2000–2015 into % tree cover categories (<20%, 21–30, 31–40, …91–100), and calculated the detection rate of sun bears within each category by dividing the total number cameras that detected a sun bear at least once within a trapping period by the total number of traps nights cameras were active. We log-transformed detection rates and increased by 1 to avoid infinite values. Camera traps were active within all levels of tree cover, and were more active in areas of high tree cover (S2 Fig). Tree cover (0–100%) at camera traps, taken from rasters of tree cover closest in time to when cameras were active, were averaged over a 6-km2 area around camera traps to represent tree cover at the scale of a core sun bear range. In a simple linear regression, sun bear detections (log) rates were positively related with % tree cover (ln([Y]/Trap Nights+1) = -8.16 + 0.03*Tree Cover, R2 = 0.7).

