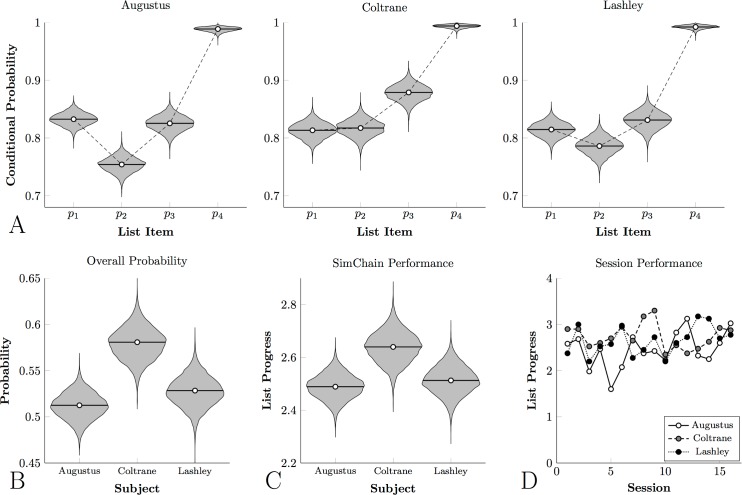
Fig 3. Monkey Category Chain performance for photographic stimuli.
In all cases, violin plots represent the posterior density for the parameter estimate. (A). Conditional response probabilities for each subject with respect to each list item. (B). Overall probability that any given trial will result in reward delivery (equal to the product of the conditional probabilities) for each subject. (C). Mean progress in the list on each trial for each subject, averaged across sessions. (D). Observed mean progress in the list on each trial for each subject, for each of the last 16 sessions.

