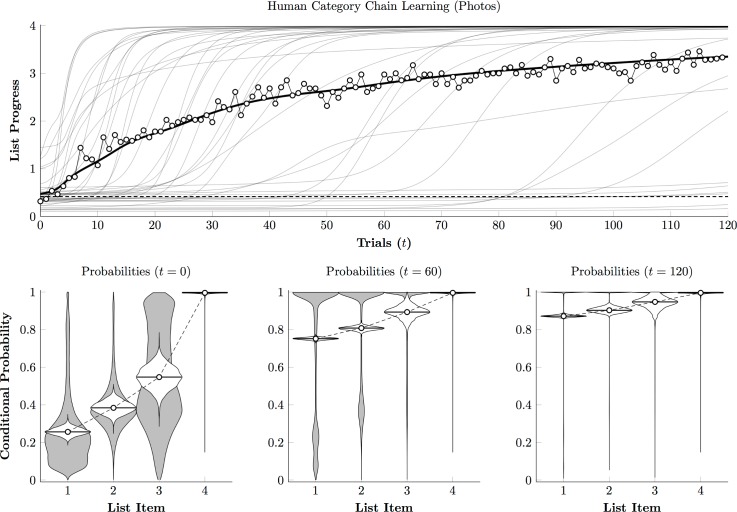
Fig 7. Human performance estimate for photographic stimuli.
(Top). Estimated time course of Category Chain performance for individual participants (gray curves) and the overall mean (black curve). White points correspond to the empirical mean of performance across subjects on each trial. Chance is indicated by the dashed line. (Bottom). Estimated conditional response probability for each list item at session onset (t = 0), midway through the session (t = 60), and after the last trial (t = 120). Violin plots show the distribution of individual probability estimates (in gray) and the credible interval for the mean probability across participants (in white). Note that mean probabilities are usually much lower than the population mode (which is near 1.0), due to a subset of participants who remain at chance throughout training.

