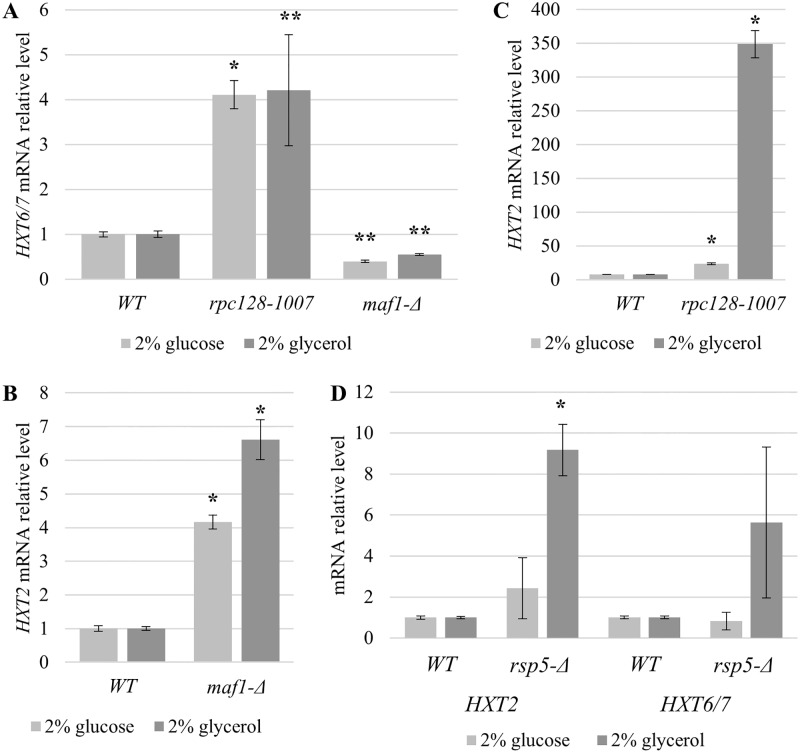
Fig 2. mRNA levels of HXT6/7 and HXT2 in strains with different RNAP III.
HXT6/7 in maf1-Δ and rpc128-1007 (A), HXT2 in maf1-Δ (B), rpc128-1007 (C) and rsp5-Δ [SPT23 1–686:URA3] (D) yeast strains. Strains were cultured in rich medium (YP) supplemented with either 2% glucose or 2% glycerol. Additionally, maf1-Δ cells grown on glycerol were shifted to 37°C for 2 h. RNA was isolated when the culture reached A600 ≈ 1 and reversed-transcribed to cDNA. Isolated RNAs were examined by SYBR GREEN-based real-time PCR. The samples were normalized to two reference genes: U2 spliceosomal RNA (U2) and small cytosolic RNA (SCR1). The bars represent ratios between the levels of respective mRNAs in the mutants and the control isogenic wild-type strain. The expression level in the WT strain (MB159-4D) was set as 1.0. The means ± standard deviations of the relative expression levels are shown. Asterisks (*) indicate p-values ≤ 0.05 determined by one-way ANOVA. Double asterisk (**) indicate p-values ≤ 0.15.

