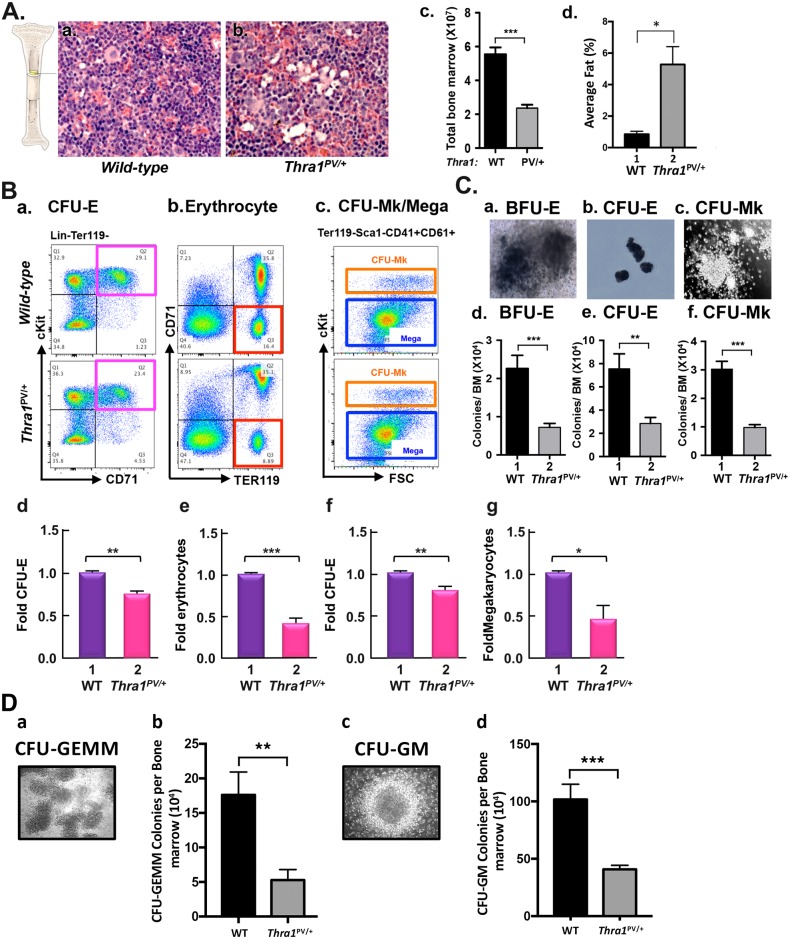
Fig 2. Decreased bone marrow cellularity and progenitors in Thra1PV/+ mice.
(A) Hematoxylin and eosin-stained femurs sections from wild-type and Thra1PV/+ mice (a and b). Magnification = X330. (c). The numbers of total bone marrow cells were counted from wild-type (panel a; n = 20) and Thra1PV/+ mice (panel b; n = 18). (d). The fat areas in the bone marrow of wild-type mice (n = 3) and Thra1PV/+ mice (n = 3) shown in Figure A-a and A-b were measured by morphometry. Values are means ± SEM (n = 3). (B) The distribution of respective erythroid and megakaryocytic populations in the bone marrow of wild type and Thra1PV/+ mice. Erythroid and megakaryocytic progenitors and mature cells were analyzed by FACS using cell surface markers. CFU-E erythrocyte progenitors identified in the bone marrow cells that had characteristics of Lin-Ter119-cKit+CD71+ (the pink box in panel a). Erythrocytes identified as CD71-Ter119+ bone marrow cells (the red box in panel b). Colony-forming units-megakaryocytes (CFU-Mk) megakaryocytic progenitors identified as Ter119-Sca1-CD41+CD61+cKit+ bone marrow cells (the orange box in panel c). Megakaryocytes were identified as Ter119-Sca1-CD41+CD61+cKit- bone marrow cells (the blue box in panel c). The numbers of CFU-E cells (panel d), erythrocytes (panel e), CFU-Mk cells (panel f), and megakaryocytes (panel g) were counted and the data calculated as fold changes in Thra1PV/+ versus wild-type mice. The representative data from three experiments are shown. Values are means ± SEM (n = 3). The p values are shown. (C) In vitro colony forming assays of bone marrow cells from wild-type and Thra1PV/+ mice (panels a-c). Morphological characteristics of burst-forming units-erythroid (BFU-E) progenitors (panel a), CFU-E progenitors (panel b), and CFU-Mk progenitor (panel c) colonies by phase contrast microscopy. Panels d, e, and f show the scored colonies of the BFU-E, CFU-E, and CFU-Mk. BFU-E was counted after 14 days. CFU-E was counted after 2 days. CFU-Mk was counted after 7 days in vitro culturing. The data are presented as ratios of total number of colonies versus total bone marrow cells. Values are means ± SEM (duplicates in each assay; WT mice, n = 7; Thra1PV/+ mice, n = 6). * denotes p<0.05; ** denotes p<0.01, *** p<0.001. (D). Morphological characteristics of multi-potential (CFU-GEMM) progenitor colonies (panel a), granulocyte/macrophage progenitor cells (CFU-GM) (panel c) by phase contrast microscopy (x100). Panels b and d show the number of colonies of CFU-GEMM and CFU-GM, respectively. The colonies were counted after 8 days in vitro culturing as described in Methods. The data are presented as number of colonies versus total bone marrow cells. Values are means ± SEM (WT mice, n = 4; Thra1PV/+ mice, n = 4; quadruplicate in each assay).

