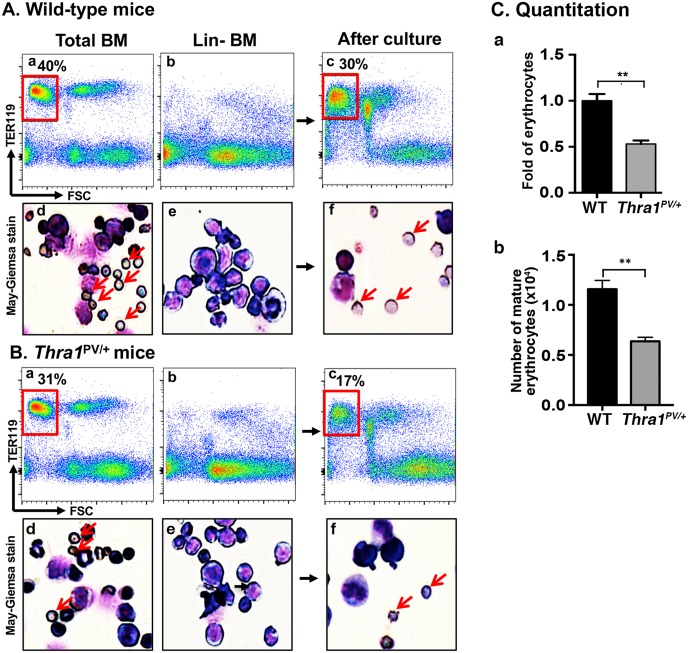
Fig 4. Decreased terminal erythroid differentiation in the lineage depleted bone marrow cells (Lin- BM) of Thra1PV/+ mice.
(A and B) Total bone marrow profile from wild-type (A-a) and Thra1PV/+ mice (B-a) as determined by flow cytometry using a late erythroid surface phenotype (Ter119+FSClow) population is boxed in red. The corresponding May-GrÜnwald-Giemsa stained cells are shown (A-d for wild-type mice and B-d for Thra1PV/+ mice). Population of Lin- BM cells from wild-type (A-b) and Thra1PV/+ (B-b) mice. After 3-day culturing, Ter119+FSClow population is shown boxed in red (A-c for wild-type mice and B-c for Thra1PV/+ mice). An arrow indicates an enucleated erythrocyte after May-GrÜnwald-Giemsa staining (A-f for wild-type mice and B-f for Thra1PV/+ mice). (C-a) Quantitative analysis shows the fold changes of erythrocytes after terminal erythroid differentiation of Lin- BM cells of wild-type and Thra1PV/+ mice. (C-b). The number of matured erythrocytes from Lin-bone marrow cells of WT mice and Thra1PV/+ mice were also compared. Values are means ± SEM (n = 3). ** denotes p<0.01.

