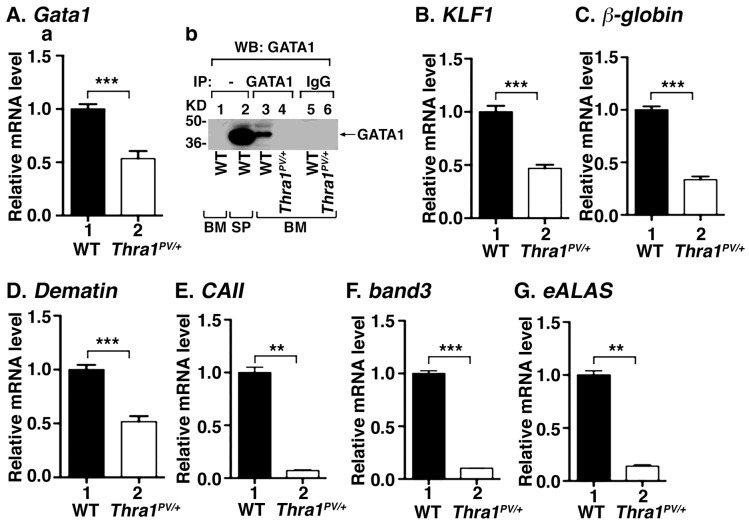
Fig 5. Decreased erythropoiesis related gene expression in the bone marrow of Thra1PV/+ mice.
The mRNA levels of Gata1 (panel A-a), Klf1 (panel B), β-globin (panel C), dematin (panel D), CA II (panel E), band 3 (panel F) and eALAS (panel G) in bone marrow cells were determined by quantitative real-time PCR. Values are means ± SEM (n = 2–4). * denotes p<0.05; ** denotes p<0.01; *** p<0.001. (A-b). Direct western blot analysis of GATA1 protein levels in the bone marrow and spleen of WT mice (lanes 1, and 2, respectively). (A-b). Analysis of the GATA1 protein levels in the bone marrow by Co-IP as described in Methods (lanes 3 and 5, WT mice; lanes 4 and 6, Thra1PV/+ mice). Lanes 5 and 6 were the negative controls using mouse IgG in the immunoprecipitation. BM: bone marrow; SP: spleen.

