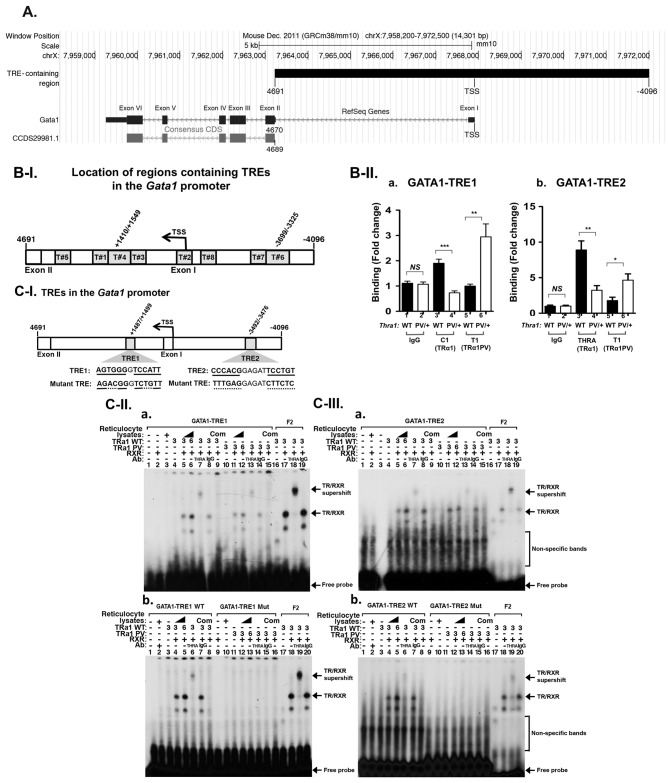
Fig 6. Identification of thyroid hormone response elements in the Gata1 promoter.
(A) Schematic representation of the mouse Gata1 gene locus. The promoter region encompassed -4096 upstream from the transcription starting site (TSS) and the intronic sequences between exon I and exon II. The ATG was from 4689 to 4691. This figure was prepared with UCSC Genome Browser <http://genome.ucsc.edu>. (B-I) The putative TRE with consensus binding half sites are marked by numbers. (B-II) ChIP analysis in the binding of TRα1 (bars 3–4) or TRα1PV (bars 5–6) to TRE1 and TRE2 in panel a and b, respectively. IgG was used as a background control. Values are means ± SEM (n = 3). (C-I) The locations and sequences of wild-type and mutated TRE1 and TRE2 in the Gata1 gene promoter. (C-II) EMSA analysis in the binding of TRα1 and TRα1PV to TRE1 (panel a) and to mutated TRE1 (panel b). (C-III) EMSA analysis in the binding of TRα1 and TRα1PV to TRE2 (panel a) and to mutated TRE2 (panel b). Lanes are marked in (C-II) and (C-III). The bands representing binding of TRE as TR/RXR heterodimers are marked by arrows.

