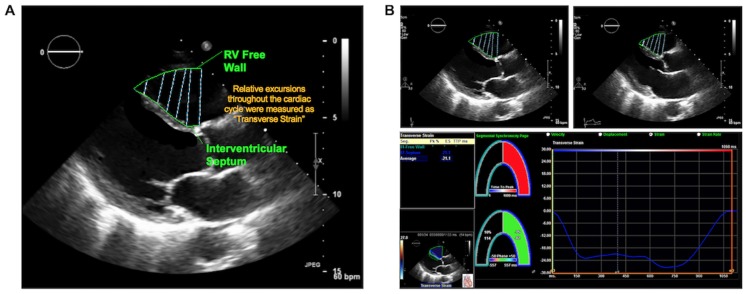
Fig 1. Illustration of analytic method for quantification of transverse strain.
1A. PLAX images were analyzed via placement of contour lines in the RV free wall and anteroseptum; transverse strain was calculated as relative excursions of the RV free wall in relation to the septum. 1B. Data output generated from PLAX transverse strain segmentation method. Primary images (end-diastole [left], end-systole [right]) with superimposed strain contours shown on top; resultant strain output and curve shown on bottom.

