MR elastography–derived shear stiffness measurements increased with advancing intervertebral disc degeneration, weakly correlated with age, and did not change between morning and afternoon measurements, which suggests that they might be an objective biomarker of the intervertebral disc degeneration process.
Abstract
Purpose
To determine the repeatability of magnetic resonance (MR) elastography–derived shear stiffness measurements of the intervertebral disc (IVD) taken throughout the day and their relationship with IVD degeneration and subject age.
Materials and Methods
In a cross-sectional study, in vivo lumbar MR elastography was performed once in the morning and once in the afternoon in 47 subjects without current low back pain (IVDs = 230; age range, 20–71 years) after obtaining written consent under approval of the institutional review board. The Pfirrmann degeneration grade and MR elastography–derived shear stiffness of the nucleus pulposus and annulus fibrosus regions of all lumbar IVDs were assessed by means of principal frequency analysis. One-way analysis of variance, paired t tests, concordance and Bland-Altman tests, and Pearson correlations were used to evaluate degeneration, diurnal changes, repeatability, and age effects, respectively.
Results
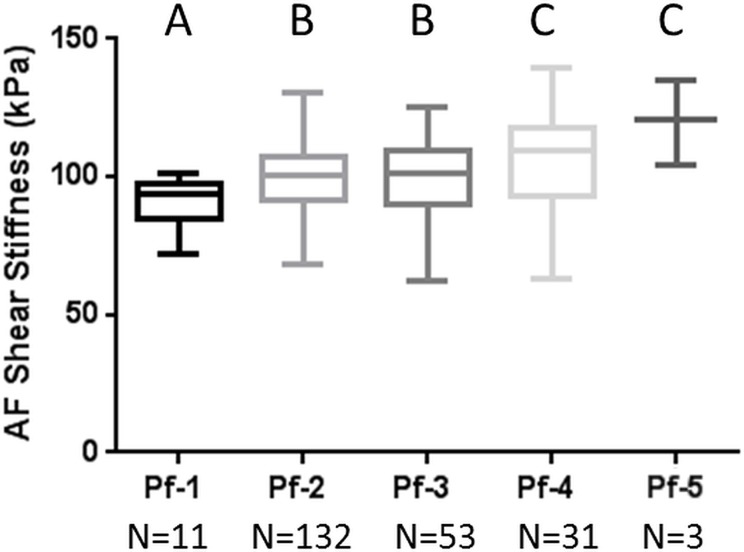
There were no significant differences between morning and afternoon shear stiffness across all levels and there was very good technical repeatability between the morning and afternoon imaging results for both nucleus pulposus (R = 0.92) and annulus fibrosus (R = 0.83) regions. There was a significant increase in both nucleus pulposus and annulus fibrosus MR elastography–derived shear stiffness with increasing Pfirrmann degeneration grade (nucleus pulposus grade 1, 12.5 kPa ± 1.3; grade 5, 16.5 kPa ± 2.1; annulus fibrosus grade 1, 90.4 kPa ± 9.3; grade 5, 120.1 kPa ± 15.4), and there were weak correlations between shear stiffness and age across all levels (R ≤ 0.32).
Conclusion
Our results demonstrate that MR elastography–derived shear stiffness measurements are highly repeatable, weakly correlate with age, and increase with advancing IVD degeneration. These results suggest that MR elastography–derived shear stiffness may provide an objective biomarker of the IVD degeneration process.
© RSNA, 2017
Online supplemental material is available for this article.
Introduction
Low back pain is the leading cause of disability worldwide and is a substantial health problem with broad clinical, social, and economic effects (1,2). Degeneration of the intervertebral disc (IVD), which is the spinal structure that facilitates flexibility and load transfer between vertebrae, is thought to be a common cause of low back pain. As personalized treatments for low back pain evolve, and therapies are developed that target different stages of IVD degeneration, the ability to objectively differentiate the current stage of disease will become increasingly important.
The current standard to assess IVD degeneration is the magnetic resonance (MR) imaging–based Pfirrmann scoring system, which is used to rank the degree of degeneration from 1 (healthy) to 5 (severely degenerated) on the basis of disc height and signal intensity (3). While this scoring system is useful as a screening tool, it is subjective and difficult to use to distinguish between the early stages of degeneration, and it provides only inferential information of tissue quality. Many groups of researchers (4–10) have demonstrated that a consequence of the matrix breakdown that occurs throughout degeneration is a progressive change in the mechanical behavior and material properties of the IVD. This suggests that changes in IVD tissue properties may provide an objective biomarker for the degeneration process that would also reflect a functional measurement of tissue quality.
MR elastography is a noninvasive imaging technique that allows a relative assessment of the shear stiffness of tissue (11) by tracking propagating strain waves as they move through soft tissue. MR elastography has been used to aid in the diagnosis of cardiac and liver diseases associated with increased tissue stiffness (12,13), and recent studies have demonstrated the feasibility of MR elastography to assess changes in IVD stiffness between healthy and severe degrees of degeneration (5,6,14). Reproducibility is a critical component of any quantitative clinical measurement. However, the mechanical behavior of the IVD is recognized to be time dependent and is influenced by the degree of tissue hydration (15,16), which can vary by up to 20% throughout the day (17). This diurnal change in tissue hydration influences the mechanical behavior of the motion segment and the compressive stiffness of the IVD (18,19). Therefore, understanding how the diurnal changes in the height of the IVD influence the technical repeatability of its MR elastography–derived shear stiffness is necessary.
Our overall objective was to determine if MR elastography could be used as an objective biomarker of the degeneration process. The aims of our study were to determine the repeatability of MR elastography–derived shear stiffness measurements of the IVD taken throughout the day and their relationship with IVD degeneration and subject age. It was hypothesized that MR elastography–derived shear stiffness would increase with advancing age and increasing Pfirrmann degeneration grade. Further, it was hypothesized that IVDs would have elevated shear stiffness in the afternoon after daytime creep loading.
Materials and Methods
Study Population
Our study was approved by the institutional review board, and written informed consent was obtained from all volunteers before they participated. MR elastography was performed on the lumbar spine of 47 subjects who currently were not experiencing low back pain (age range, 20–71 years). Other exclusion criteria included contraindications for MR imaging such as metallic implants that were not safe for MR imaging, pregnancy, or claustrophobia. With 47 subjects, each with five discs, 90% power was achieved to detect a 30% difference of IVD stiffness between degeneration scores. This sample size also provided us with 90% power to detect a 30% difference between morning and afternoon examinations. All examinations occurred between March 2015 and May 2016.
Experimental Setup
All imaging was performed with a 3-T MR imager (Tim Trio; Siemens Healthcare, Erlangen, Germany). Volunteers were placed in the imager in a supine head-first position. For MR elastographic examinations, 80-Hz mechanical vibrations were applied to the lower back by means of a commercially available passive pneumatic driver system (Fig E1 [online]; Resoundant, Rochester, Minn) that has been used previously for MR elastography of liver and cardiac tissue (20). The passive driver was strapped to the volunteer’s lower back with a neoprene band and was positioned between the volunteer’s iliac crests, approximately centered on the L3–4 IVD. All lumbar levels with sufficient disc height (> 2.5 mm) were imaged. The L5–S1 IVD was defined as the first IVD superior to the sacrum, and all subsequent IVDs were classified accordingly. Volunteers were imaged twice on the same day, once in the morning and again in the afternoon, with an average of 6.4 hours between examinations.
Image Acquisition
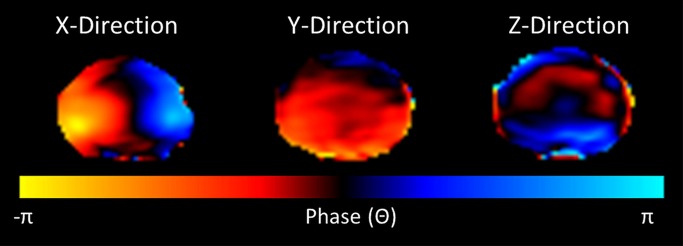
Sagittal T2-weighted images of the lumbar spine were acquired and used to assign a Pfirrmann degeneration score to each IVD. A standard T2-weighted transverse sequence of each IVD was performed immediately before the application of a standard gradient-recalled-echo MR elastographic sequence (13), which was used to image a two-dimensional transverse section through each IVD (Fig 1a) (B.W. and P.M., with 8 and 10 years of experience in spine research, respectively; and B.D.R., with 11 years of experience in MR imaging). Imaging parameters included repetition time msec/echo time msec, 37.5/18.55; field of view, 300 × 300 mm; acquisition matrix, 256 × 64 reconstructed to 256 × 256; flip angle, 25°; section thickness, 5 mm or 2.5 mm; MR elastographic phase offsets, four. A section thickness of 5 mm was used unless there was insufficient disc space, in which case, a section thickness of 2.5 mm was used. A motion-encoding gradient of 80 Hz was applied separately in the x, y, and z directions to encode the in-plane and through-plane displacement fields (Fig 1b, Movies E1–E3 [online]).
Figure 1a:
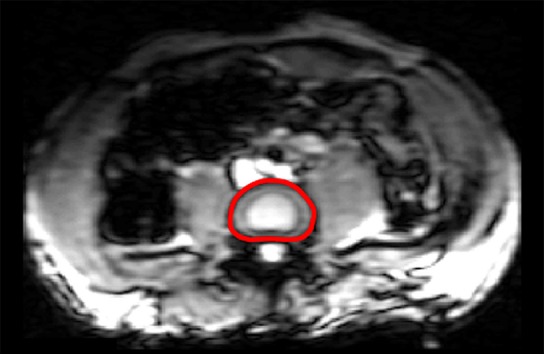
MR elastographic wave propagation. (a) Transverse T2-weighted image shows lumbar spine of a 35-year-old man, with red line delineating IVD region of interest (ROI). (b) Phase images show wave propagation through IVD in the x, y, and z direction. (c) Schematic shows segmented ROI of nucleus pulposus (AF) and annulus fibrosus (NP) regions.
Figure 1b:
MR elastographic wave propagation. (a) Transverse T2-weighted image shows lumbar spine of a 35-year-old man, with red line delineating IVD region of interest (ROI). (b) Phase images show wave propagation through IVD in the x, y, and z direction. (c) Schematic shows segmented ROI of nucleus pulposus (AF) and annulus fibrosus (NP) regions.
Movie 1.
Waves moving through IVD in x direction.
Movie 2.
Waves moving through IVD in y direction.
Movie 3.
Waves moving through IVD in z direction.
Image Analysis
All MR elastographic wave image analyses were conducted by using a custom code (Matlab; Mathworks, Natick, Mass). The IVD ROI was traced by hand from transverse images of each IVD (B.W.) and applied to all MR elastographic magnitude and phase images. The ROI of the NP and AF regions were determined by using a custom algorithm (Matlab; Mathworks) defined from the original IVD ROI (Fig 1c) (B.W.). This algorithm was required because the differentiation between the NP and AF regions in severely degenerated IVDs (Pfirrmann grades 4 and 5) was not clearly visible and would have precluded assessment of stiffness in IVDs with advanced degeneration. The automated NP region was selected by eroding the edge of the hand-traced whole IVD ROI, leaving a centralized area that was within the original IVD. The degree of erosion was chosen so that the average of the remaining relative area (ie, NP area/total IVD area) was approximately the same as the relative cross-sectional area of the hand-traced NP ROI relative to the whole IVD ROI (n = 195 IVDs; relative area of hand-traced NP ROI, 35.2% ± 6.1; relative area of automated NP ROI, 34.7% ± 5.6). The degree of overlap between the automated ROI and the hand-traced NP ROI in these IVDs where the AF and NP demarcation was visible was 84.3% ± 12.6. The AF ROI was defined as the difference between the whole IVD and the automated NP ROI. To further evaluate the validity of the automated ROI algorithm, the stiffness results in all IVDs where the NP region could be traced by hand were compared with the corresponding stiffness from the automated ROIs, with an average difference of 0.03 kPa and 1.2 kPa in the NP and AF regions, respectively (Table E1 [online]). A Bland-Altman test was used to determine the difference between average shear stiffness by using the hand-traced ROI and automated ROI in the NP and AF regions (Fig E2 [online]). We considered the advantage of being able to assess the stiffness in the AF and NP regions in IVDs of all degenerative grades to outweigh any potential costs of slight differences in tissue stiffness.
Figure 1c:

MR elastographic wave propagation. (a) Transverse T2-weighted image shows lumbar spine of a 35-year-old man, with red line delineating IVD region of interest (ROI). (b) Phase images show wave propagation through IVD in the x, y, and z direction. (c) Schematic shows segmented ROI of nucleus pulposus (AF) and annulus fibrosus (NP) regions.
The shear stiffness of the AF and NP regions from each IVD were calculated by using a modified principal frequency analysis that had been adapted from prior work (B.W., P.K., with 3 years of experience in biomedical engineering) (21). The principal frequency analysis method was chosen because it allows a global assessment of the wavelength within an ROI by identifying the principal frequency. This technique has the added advantage that it can allow determination of stiffness in the AF region, which is often underestimated when other MR elastographic analysis methods are used because of the high stiffness and small ROI of the tissue. Because of the bony anatomy immediately surrounding the IVD and the changing orientation between the driver and the different IVD levels, the mechanical wave within the IVD is multidimensional and requires filtering to remove longitudinal motion and reflected waves. For the filtering process, the wave data were first Fourier transformed along the time domain to obtain the first harmonic displacement. Then a directional filter was applied along eight directions to remove the reflected waves, and wave data were passed through a band-pass filter (fourth order cutoff values for NP, 4–40 waves per field of view; cutoff values for AF, 1–40 waves per field of view) to remove the longitudinal waves. Then the principal frequency analysis was performed along three encoding directions to report the weighted stiffness value (22) over the entire ROI separately for the NP and AF regions. The principal frequency analysis method is robust to noise and has been used previously in noise-dominated data; however, in our data we have found a signal-to-noise ratio of greater than or equal to 3 can be used to estimate accurate stiffness values.
Pfirrmann Degeneration Scoring
Five physicians experienced in spine imaging (D.J.B., with 8 years of experience in Radiology; H.M., with 7 years of experience in Neurosurgery; X.V.N., with 8 years of experience in radiology;L.M.P., with 10 years of experience in radiology; and W.T., with 7 years of experience in neurosurgery) were blinded, and they scored all IVDs three times. The average of the 15 Pfirrmann scores per IVD was rounded to the nearest whole number and the rounded score was assigned to each IVD.
Statistical Analysis
Stiffness values were found to be normally distributed (P < .05) by using a Kolmogorov-Smirnov test. Paired t tests were used to compare morning and afternoon stiffness. In addition, concordance tests and Bland-Altman analyses were performed to determine the repeatability of the stiffness measures in the morning and the afternoon (23,24). The comparisons between spinal levels were performed by using analysis of variance with repeated measures followed by pair-wise and trend tests. The comparisons among Pfirrmann degeneration scores were performed by using a one-way analysis of variance followed by pair-wise and trend tests. The correlation between age and stiffness for each spinal level was evaluated by using the Pearson correlation method. All statistical analyses were conducted with software (SAS 9.4; SAS Institute, Cary, NC), and a P value of less than .05 was considered to indicate a significant difference (X.M., with 10 years of experience in statistics). The within-rater agreement among assigned Pfirrmann degeneration scores was represented as intraclass correlation coefficients with software (Stata 12; StataCorp, College Station, Tex) (25,26).
Results
Volunteer Demographics
A total of 47 individuals were imaged, including 30 men and 17 women with an age range of 20–71 years (age 20–29 years, 10 men and seven women; age 30–39 years, 10 men and four women; age 40–49 years, two men and two women; age 50–59 years, one man and two women; age 60–69 years, six men and two women; age 71, one man). Seven of the 47 individuals were only imaged once because of unexpected scheduling conflicts. These individuals were excluded from the diurnal comparison results.
Technical Repeatability of MR Elastography–derived IVD Stiffness
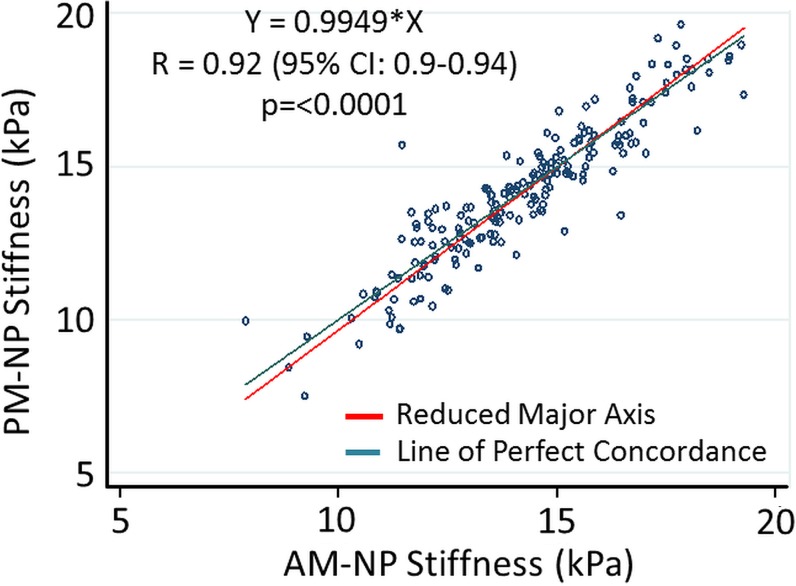
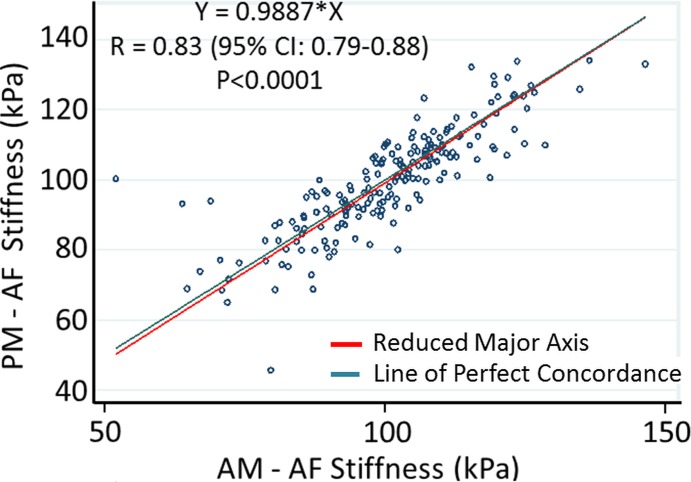
No significant differences were observed between the MR elastography–derived shear stiffness measures of morning and afternoon examinations for both NP and AF regions (Table 1, Fig E3 [online]). There were significant differences in MR elastography–derived shear stiffness between different IVD levels (Table 1). These differences were observed in both NP and AF regions and demonstrated that the MR elastography–derived shear stiffness of L2–3, L3–4, and L4–5 were slightly greater (approximately 1.5 kPa) than those of L1–2 and L5–S1. There was a high concordance correlation between the morning and afternoon examinations (Fig 2) for both the NP region (Rc = 0.92, 95% confidence interval [CI]: 0.90, 0.94; P < .001) and the AF region (Rc = 0.83; 95% CI: 0.79, 0.88; P < .001), demonstrating good repeatability for MR elastography–derived shear stiffness measurements. Further, Bland-Altman test results demonstrated a small nonsignificant average bias of 0.068 kPa (95% CI: −1.7, 1.8) in the NP region and 0.84 kPa (95% CI: −15.8, 17.6) in the AF regions between morning and afternoon examinations (Fig E4 [online]).
Table 1.
Diurnal Changes in MR Elastography–derived Shear Stiffness
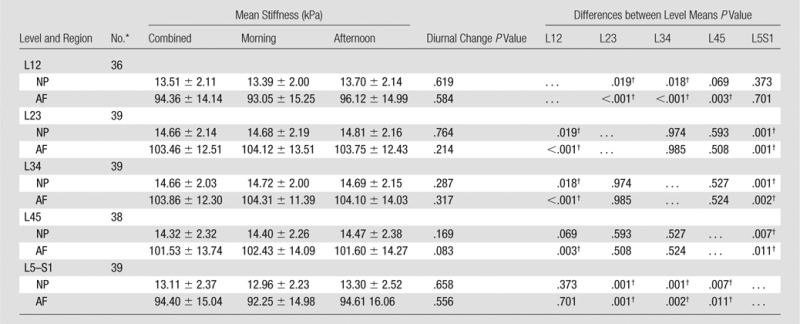
Note.—Unless otherwise indicated, data are means ± standard deviation.
*Data are number of paired examinations (morning and afternoon).
†Indicates a significant difference.
Figure 2a:
Technical repeatability of MR elastography–derived shear stiffness measurements of IVD. Scatterplots show concordance correlations between morning (AM) and evening (PM) measurements of MR elastography–derived shear stiffness for the (a) NP (R = 0.92) and (b) AF (R = 0.83) regions.
Figure 2b:
Technical repeatability of MR elastography–derived shear stiffness measurements of IVD. Scatterplots show concordance correlations between morning (AM) and evening (PM) measurements of MR elastography–derived shear stiffness for the (a) NP (R = 0.92) and (b) AF (R = 0.83) regions.
Relationship between Pfirrmann Degeneration and MR Elastography–derived Shear Stiffness
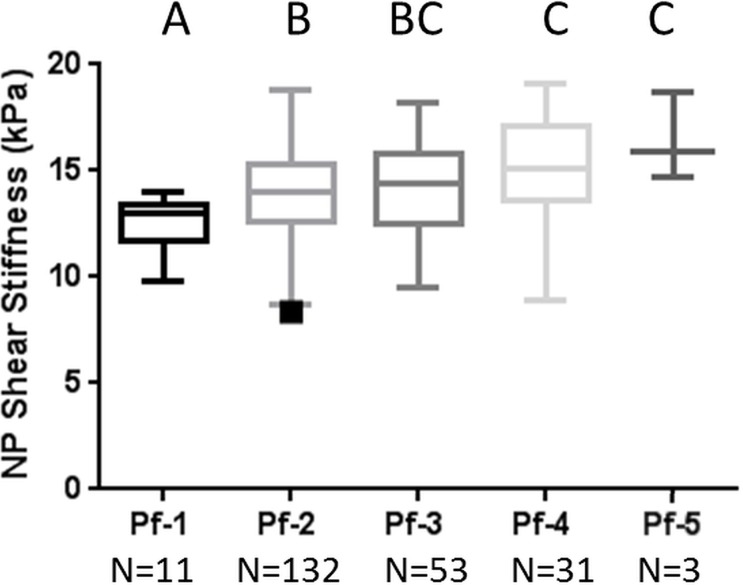
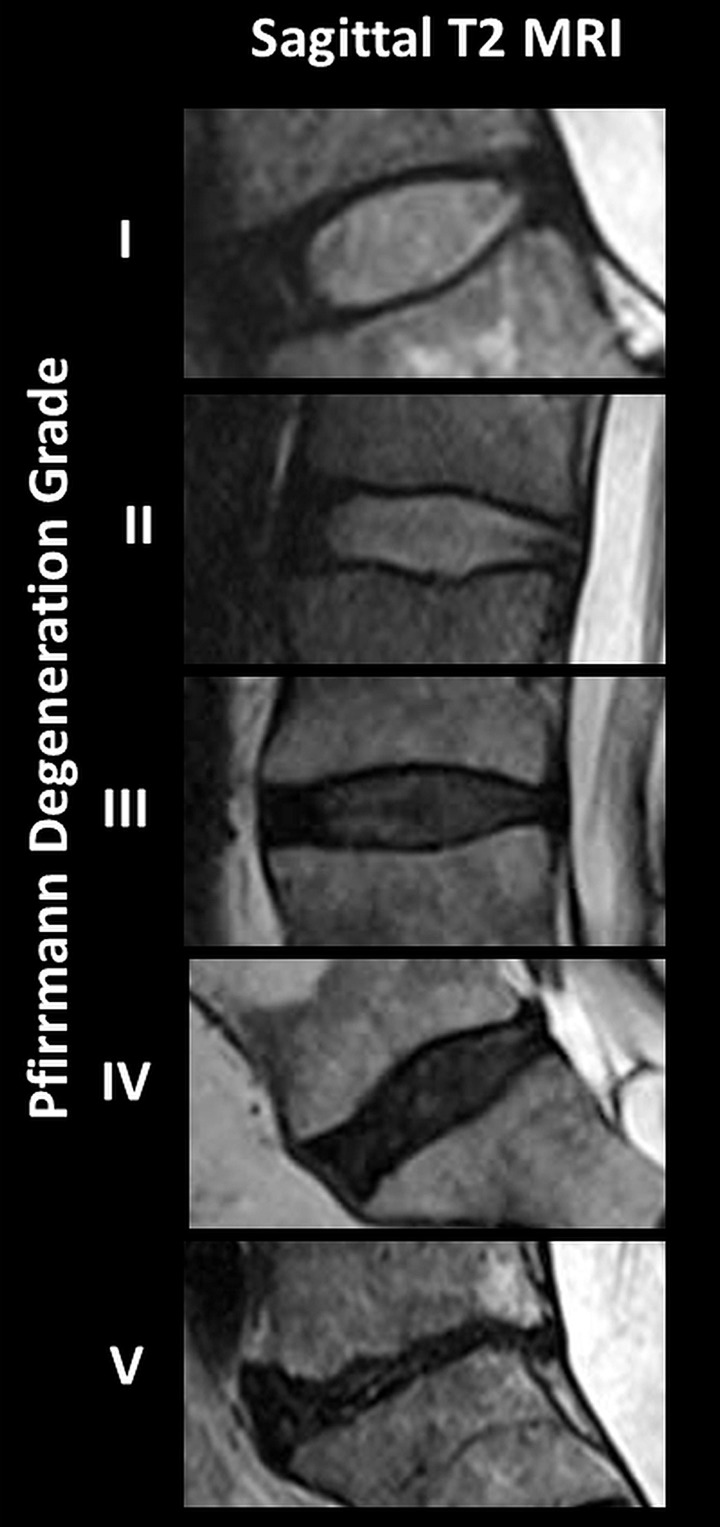
The MR elastography–derived shear stiffness of the AF and NP regions from a total of 230 IVDs were compared throughout all five Pfirrmann degeneration grades (Fig 3, Table 2). There was a significant increase in MR elastography–derived shear stiffness as the Pfirrmann degeneration grade increased in both AF (P < .001) and NP (P = .003) regions based on the trend tests. In the NP region, there was a significant difference between grade 1 and all other grades and between grade 2 and grades 4 and 5. In the AF region, there was a significant difference between grade 1 and all other grades, between grade 2 and grades 4 and 5, and between grade 3 and grades 4 and 5. Representative T2-weighted sagittal images of IVDs for each Pfirrmann grade are shown in Figure 3c. The intrarater agreement and interrater agreement of assigned Pfirrmann degeneration scores are shown in Table E2 (online).
Figure 3a:
MR elastography–derived shear stiffness increases with Pfirrmann degeneration score. Tukey box and whisker plots show change in MR elastography–derived shear stiffness with Pfirrmann degeneration score for (a) NP region and (b) AF region. Different letters indicate significant pairwise differences. (c) Representative sagittal T2-weighted images of IVDs show different degrees of Pfirrmann degeneration grades.
Table 2.
Relationship between MR Elastography–derived Shear Stiffness and Pfirrmann Degeneration Grade
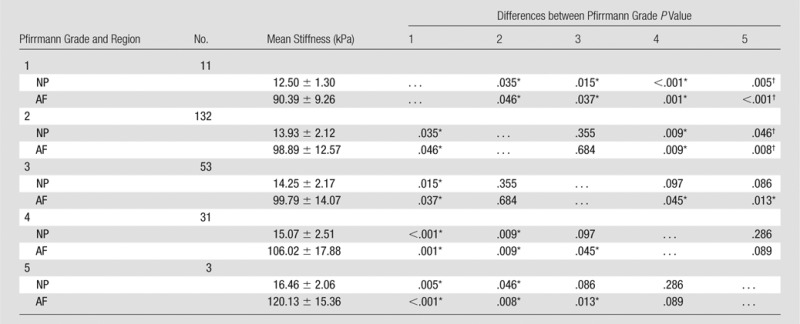
Note.—Unless otherwise indicated, data are means ± standard deviation.
*Indicates a significant difference.
Figure 3c:
MR elastography–derived shear stiffness increases with Pfirrmann degeneration score. Tukey box and whisker plots show change in MR elastography–derived shear stiffness with Pfirrmann degeneration score for (a) NP region and (b) AF region. Different letters indicate significant pairwise differences. (c) Representative sagittal T2-weighted images of IVDs show different degrees of Pfirrmann degeneration grades.
Figure 3b:
MR elastography–derived shear stiffness increases with Pfirrmann degeneration score. Tukey box and whisker plots show change in MR elastography–derived shear stiffness with Pfirrmann degeneration score for (a) NP region and (b) AF region. Different letters indicate significant pairwise differences. (c) Representative sagittal T2-weighted images of IVDs show different degrees of Pfirrmann degeneration grades.
Relationship between Age and MR elastography–derived Shear Stiffness
Degeneration is thought to be related to advancing age (8); therefore, correlations between MR elastography–derived IVD shear stiffness and subject age were conducted at each level. There were weak correlations between MR elastography–derived shear stiffness values and age (R ≤ 0.32) throughout all levels for both NP and AF regions, but the difference was only significant in the AF at level L2–3 (Table 3).
Table 3.
Correlation between Shear Stiffness and Age in Different IVD Regions

Discussion
In our study, we evaluated whether MR elastography–derived shear stiffness could noninvasively provide an objective classification of the IVD degeneration process. Our results demonstrated that MR elastography–derived shear stiffness measurements significantly increased with Pfirrmann degeneration scores and were able to allow differentiation between different grades of degeneration. In addition, MR elastography–derived stiffness measurements of IVDs showed good reproducibility between morning and afternoon examinations and did not correlate with subject age. Overall, results suggest that MR elastography–derived shear stiffness may serve as a biomarker of the degeneration process and may provide objective information that is complementary to the changes in IVD height and signal intensity gained from the Pfirrmann degeneration scoring system.
Our results demonstrated that there were no differences between the morning and afternoon MR elastography–derived shear stiffness measurements in either the NP or AF regions. In addition, the high concordance correlation between the MR elastography–derived shear stiffness measurements from morning and afternoon examinations demonstrated very good technical repeatability of the MR elastography–derived shear stiffness measurements. Together, these results suggest that the change in IVD height that occurred between examinations did not influence the repeatability of the shear stiffness measurements. Because these examinations occurred throughout the course of a normal day, these findings suggest that authors of future studies do not need to account for time of day at which an examination takes place. It is possible that if the duration between examinations (6.4 hours) had been greater, a small diurnal variation may have been observed. Originally, 12 hours between examinations was considered; however, limited subject compliance due to scheduling challenges requiring subjects to come at odd hours prevented this longer time point. On the basis of the nonlinear creep behavior of the IVD, with the greatest height losses occurring soon after loading is applied (typically in the morning), the duration between examinations was expected to capture approximately 50%–60% of the daily height loss (27). Further, the gap between examinations in our study was similar in duration to that of a prior study (17), in which researchers observed a 20% decrease in IVD volume and an approximately 11% decrease in IVD height with a 7-hour gap consisting of 4 hours of standing and 3 hours of sitting. Therefore, although the additional deformation that was not captured may have influenced the shear stiffness, it likely would have had only a limited effect on the magnitude of the shear stiffness measurement.
MR elastography–derived shear stiffness measurements of both NP and AF regions increased with advancing degeneration. This finding was consistent with those of in vitro rheological studies (4,28,29) in which severely degenerated IVD tissue had an elevated shear modulus, and with the general understanding that the IVD tissue becomes more fibrotic throughout the degeneration process. Authors of prior MR elastographic studies (5,6) also found that there were changes in IVD shear properties with degeneration; however, their findings showed decreased stiffness with degeneration, while our results demonstrated that shear stiffness increased with degeneration. An acknowledged limitation of the prior MR elastographic studies was that the inversion algorithms that were used allowed substantial underestimation of the shear stiffness in very stiff tissues. This underestimation occurs because, as the tissue becomes stiffer, the wavelength of the shear wave increases to such an extent that an accurate assessment of the wave number cannot be obtained within the ROI (6). We believe that the opposing changes in shear stiffness with degeneration are directly related to differences in the analysis techniques. Despite these differences, our results and these prior rheological and MR elastographic studies demonstrate that MR elastography–derived shear stiffness measurements may be used to differentiate between healthy and degenerated IVDs.
The MR elastography–derived shear stiffness measurements found in our study are similar to rheologically derived shear modulus measurements (nondegenerated NP, 7.4 kPa ± 11.6; AF, 200 kPa ± 70; severely degenerated NP, 22.5 kPa ± 7.8; AF, 290 kPa ± 135) (28,29). Rheologic testing is considered a reference standard for assessment of shear properties of materials; however, it is not feasible in vivo. The similarity between MR elastography and rheologically derived shear measurements suggests that the MR elastographic assessment of IVD tissue is reflective of a functional change in the response of a tissue to loading.
IVD degeneration has been described as accelerated aging; therefore, we investigated whether there was a correlation between MR elastography–derived shear stiffness and age. We observed that there were weak correlations between subject age and shear stiffness in both NP and AF regions throughout all levels, with only one being significant. This suggests that the change in MR elastography–derived shear stiffness that occurs with degeneration may be independent of age. Our population age range was large: 20–71 years; however, only seven individuals were in the 40–60 years old range. While our results showed that MR elastography–derived shear stiffness may be independent of age, additional work is required to fully characterize this relationship.
A limitation of our study was that the principal frequency analysis method does not allow the creation of stiffness maps that allow visualization of the spatial variations in tissue stiffness. Future three-dimensional examinations may allow the creation of stiffness maps that represent the stiffness in smaller sub-ROIs, or quadrants of the AF and NP regions and the characterization of a specific area of tissue weakness. In addition, the principal frequency analysis method only allows a single value for each ROI and does not provide a standard deviation of the stiffness within each region. Therefore, the homogeneity of the IVD tissue, which also may be a measure of degeneration, could not be assessed. Small differences between spinal levels also were observed; with the L1–2 and L5–S1 levels being lower than the central levels (L2–3 through L4–5). Although this difference may be influenced by the differential prevalence of degenerated IVDs within different levels, we believe that this level variation is more likely related to the shape and placement of the passive driver, which was approximately centered at the L3–4 level and may lead to complex two-dimensional wave propagation in the levels farthest away from the vibration source. Future studies should should be performed to investigate if alternate driver placement or shape influences the stiffness measurements of the L1–2 and L5–S1 levels.
Many groups (30–34) have highlighted the utility of MR imaging to understand IVD disease progression by correlating various quantitative MR imaging measurements with the IVDs composition and degenerative grade (30–34). While understanding IVD composition is valuable for multiple applications and is correlated with the mechanical behavior of the tissue, it is not directly related to mechanical function of the tissue, which is influenced by both the composition and orientation of the extracellular matrix components. The use of MR elastography facilitates a direct measure of the mechanical integrity of the IVD in terms of the tissue’s shear stiffness. This measurement, in addition to more traditional assessments related to tissue composition, can provide a more complete assessment of how well the tissue can fulfill its mechanical function, which may become clinically valuable.
Clinical implementation of MR elastography would require acquisition of the commercially available driver system and MR elastographic sequences. The practical implications involve slightly increased examination times and minimal increases in patient preparation time (approximately 5 minutes), which are associated with driver placement and positioning of cushions for subject comfort. The examination time in our study was approximately 40 minutes per session, which allowed the anatomic and MR elastographic information for all five lumbar levels to be obtained. However, the examination time can be reduced with further sequence refinement and targeting of specific IVDs. The primary technical considerations for obtaining comparable MR elastographic information regards the applied frequency of mechanical vibrations and the type of wave analysis (two dimensional vs three dimensional). The frequency of mechanical vibrations is important, because soft tissue is viscoelastic and the measured stiffness is frequency dependent.
In conclusion, we demonstrated that MR elastography–derived shear stiffness measurements increased with advancing IVD degeneration, weakly correlated with age, and did not change between morning and afternoon measurements. In addition, the similarity of MR elastography–derived and rheologically derived shear measurements of IVD tissue suggests that MR elastographic assessment of IVD tissue may provide a measure of tissue quality. Overall, our results suggest MR elastography–derived shear stiffness may provide an objective biomarker of the IVD degeneration process that reflects how the mechanical integrity of the tissue may change with degeneration, which can complement Pfirrmann classification of IVD degeneration.
Advances in Knowledge
■ MR elastography of the intervertebral disc (IVD) is highly repeatable (concordance correlation coefficient, Rc = 0.92) and is not influenced by changes in IVD height that occur during normal daily activities.
■ MR elastography–derived shear stiffness measurements of the nucleus pulposus and annulus fibrosus region of the IVD significantly increased with increasing Pfirrmann degeneration grade (trend test: annulus fibrosus region, P < .001; nucleus pulposus region, P = .002).
■ MR elastography–derived shear stiffness measurements of nucleus pulposus and annulus fibrosus tissue are similar in magnitude to previously reported rheological measurements of IVD shear properties, which suggests that they may be a functional measure of tissue quality.
Implication for Patient Care
■ MR elastography–derived shear stiffness measurements can serve as a quantitative biomarker for IVD degeneration, providing objective information derived from the mechanical behavior of the tissue, and can complement the current Pfirrmann classification of IVD degeneration.
SUPPLEMENTAL TABLES
SUPPLEMENTAL FIGURES
Received October 5, 2016; revision requested November 23; revision received December 23; accepted January 31, 2017; final version accepted February 9.
A.K. supported by National Heart, Lung, and Blood Institute (R01HL124096) and the Center for Clinical and Translational Sciences at Ohio State University (UL1TR000090). Study supported by the Spine Research Institute.
Current address: Department of Neurologic Surgery, Ain Shams University, Cairo, Egypt.
Disclosures of Conflicts of Interest: B.A.W. disclosed no relevant relationships. P.M. disclosed no relevant relationships. X.M. disclosed no relevant relationships. D.J.B. disclosed no relevant relationships. H.M. disclosed no relevant relationships. X.V.N. disclosed no relevant relationships. L.M.P. disclosed no relevant relationships. W.T. B.D.R. disclosed no relevant relationships. P.K. disclosed no relevant relationships. E.M. disclosed no relevant relationships. W.S.M. disclosed no relevant relationships. A.K. Activities related to the present article: disclosed no relevant relationships. Activities not related to the present article: consultancy for the University of Auckland, honorarium from GE, travel expenses from the University of Edinburgh, University of Groningen, Louisiana State University, the Mayo Clinic, and SCMR. Other relationships: disclosed no relevant relationships.
Abbreviations:
- AF
- annulus fibrosus
- IVD
- intervertebral disc
- NP
- nucleus pulposus
- ROI
- region of interest
References
- 1.Vos T, Flaxman AD, Naghavi M, et al. Years lived with disability (YLDs) for 1160 sequelae of 289 diseases and injuries 1990-2010: a systematic analysis for the Global Burden of Disease Study 2010. Lancet 2012;380(9859):2163–2196. [DOI] [PMC free article] [PubMed] [Google Scholar]
- 2.Katz JN. Lumbar disc disorders and low-back pain: socioeconomic factors and consequences. J Bone Joint Surg Am 2006;88(Suppl 2):21–24. [DOI] [PubMed] [Google Scholar]
- 3.Pfirrmann CW, Metzdorf A, Zanetti M, Hodler J, Boos N. Magnetic resonance classification of lumbar intervertebral disc degeneration. Spine 2001;26(17):1873–1878. [DOI] [PubMed] [Google Scholar]
- 4.Iatridis JC, Setton LA, Weidenbaum M, Mow VC. Alterations in the mechanical behavior of the human lumbar nucleus pulposus with degeneration and aging. J Orthop Res 1997;15(2):318–322. [DOI] [PubMed] [Google Scholar]
- 5.Cortes DH, Magland JF, Wright AC, Elliott DM. The shear modulus of the nucleus pulposus measured using magnetic resonance elastography: a potential biomarker for intervertebral disc degeneration. Magn Reson Med 2014;72(1):211–219. [DOI] [PMC free article] [PubMed] [Google Scholar]
- 6.Streitberger KJ, Diederichs G, Guo J, et al. In vivo multifrequency magnetic resonance elastography of the human intervertebral disk. Magn Reson Med 2015;74(5):1380–1387. [DOI] [PubMed] [Google Scholar]
- 7.Gu WY, Mao XG, Rawlins BA, et al. Streaming potential of human lumbar anulus fibrosus is anisotropic and affected by disc degeneration. J Biomech 1999;32(11):1177–1182. [DOI] [PubMed] [Google Scholar]
- 8.Adams MA, Roughley PJ. What is intervertebral disc degeneration, and what causes it? Spine 2006;31(18):2151–2161. [DOI] [PubMed] [Google Scholar]
- 9.Yong-Hing K, Kirkaldy-Willis WH. The pathophysiology of degenerative disease of the lumbar spine. Orthop Clin North Am 1983;14(3):491–504. [PubMed] [Google Scholar]
- 10.Muriuki MG, Havey RM, Voronov LI, et al. Effects of motion segment level, Pfirrmann intervertebral disc degeneration grade and gender on lumbar spine kinematics. J Orthop Res 2016;34(8):1389–1398. [DOI] [PubMed] [Google Scholar]
- 11.Manduca A, Oliphant TE, Dresner MA, et al. Magnetic resonance elastography: non-invasive mapping of tissue elasticity. Med Image Anal 2001;5(4):237–254. [DOI] [PubMed] [Google Scholar]
- 12.Kolipaka A, Woodrum D, Araoz PA, Ehman RL. MR elastography of the in vivo abdominal aorta: a feasibility study for comparing aortic stiffness between hypertensives and normotensives. J Magn Reson Imaging 2012;35(3):582–586. [DOI] [PMC free article] [PubMed] [Google Scholar]
- 13.Chamarthi SK, Raterman B, Mazumder R, et al. Rapid acquisition technique for MR elastography of the liver. Magn Reson Imaging 2014;32(6):679–683. [DOI] [PMC free article] [PubMed] [Google Scholar]
- 14.Ben-Abraham EI, Chen J, Felmlee JP, et al. Feasibility of MR elastography of the intervertebral disc. Magn Reson Imaging 2015;39:132–137. [DOI] [PMC free article] [PubMed] [Google Scholar]
- 15.Urban JP, McMullin JF. Swelling pressure of the lumbar intervertebral discs: influence of age, spinal level, composition, and degeneration. Spine 1988;13(2):179–187. [DOI] [PubMed] [Google Scholar]
- 16.Adams MA, Dolan P, Hutton WC. Diurnal variations in the stresses on the lumbar spine. Spine 1987;12(2):130–137. [DOI] [PubMed] [Google Scholar]
- 17.Botsford DJ, Esses SI, Ogilvie-Harris DJ. In vivo diurnal variation in intervertebral disc volume and morphology. Spine 1994;19(8):935–940. [DOI] [PubMed] [Google Scholar]
- 18.Jamison D, Marcolongo MS. The effect of creep on human lumbar intervertebral disk impact mechanics. J Biomech Eng 2014;136(3):031006. [DOI] [PubMed] [Google Scholar]
- 19.Adams MA, Dolan P, Hutton WC, Porter RW. Diurnal changes in spinal mechanics and their clinical significance. J Bone Joint Surg Br 1990;72(2):266–270. [DOI] [PubMed] [Google Scholar]
- 20.Kenyhercz WE, Raterman B, Illapani VS, et al. Quantification of aortic stiffness using magnetic resonance elastography: Measurement reproducibility, pulse wave velocity comparison, changes over cardiac cycle, and relationship with age. Magn Reson Med 2016;75(5):1920–1926. [DOI] [PMC free article] [PubMed] [Google Scholar]
- 21.McGee KP, Lake D, Mariappan Y, et al. Calculation of shear stiffness in noise dominated magnetic resonance elastography data based on principal frequency estimation. Phys Med Biol 2011;56(14):4291–4309. [DOI] [PMC free article] [PubMed] [Google Scholar]
- 22.Wassenaar PA, Eleswarpu CN, Schroeder SA, et al. Measuring age-dependent myocardial stiffness across the cardiac cycle using MR elastography: A reproducibility study. Magn Reson Med 2016;75(4):1586–1593. [DOI] [PMC free article] [PubMed] [Google Scholar]
- 23.Lin LI. A concordance correlation coefficient to evaluate reproducibility. Biometrics 1989;45(1):255–268. [PubMed] [Google Scholar]
- 24.Bland JM, Altman DG. Statistical methods for assessing agreement between two methods of clinical measurement. Lancet 1986;1(8476):307–310. [PubMed] [Google Scholar]
- 25.Shrout PE, Fleiss JL. Intraclass correlations: uses in assessing rater reliability. Psychol Bull 1979;86(2):420–428. [DOI] [PubMed] [Google Scholar]
- 26.McGraw KO, Wong SP. Forming inferences about some intraclass correlation coefficients. Psychol Methods 1996;1(1):30–46. [Google Scholar]
- 27.van der Veen AJ, Bisschop A, Mullender MG, van Dieën JH. Modelling creep behaviour of the human intervertebral disc. J Biomech 2013;46(12):2101–2103. [DOI] [PubMed] [Google Scholar]
- 28.Iatridis JC, Kumar S, Foster RJ, Weidenbaum M, Mow VC. Shear mechanical properties of human lumbar annulus fibrosus. J Orthop Res 1999;17(5):732–737. [DOI] [PubMed] [Google Scholar]
- 29.Iatridis JC, Setton LA, Weidenbaum M, Mow VC. The viscoelastic behavior of the non-degenerate human lumbar nucleus pulposus in shear. J Biomech 1997;30(10):1005–1013. [DOI] [PubMed] [Google Scholar]
- 30.Zobel BB, Vadalà G, Del Vescovo R, et al. T1ρ magnetic resonance imaging quantification of early lumbar intervertebral disc degeneration in healthy young adults. Spine 2012;37(14):1224–1230. [DOI] [PMC free article] [PubMed] [Google Scholar]
- 31.Auerbach JD, Johannessen W, Borthakur A, et al. In vivo quantification of human lumbar disc degeneration using T(1rho)-weighted magnetic resonance imaging. Eur Spine J 2006;15(Suppl 3):S338–S344. [DOI] [PMC free article] [PubMed] [Google Scholar]
- 32.Gullbrand SE, Ashinsky BG, Martin JT, et al. Correlations between quantitative T2 and T1ρ MRI, mechanical properties and biochemical composition in a rabbit lumbar intervertebral disc degeneration model. J Orthop Res 2016;34(8):1382–1388. [DOI] [PMC free article] [PubMed] [Google Scholar]
- 33.Wang C, McArdle E, Fenty M, et al. Validation of sodium magnetic resonance imaging of intervertebral disc. Spine 2010;35(5):505–510. [DOI] [PMC free article] [PubMed] [Google Scholar]
- 34.Wang C, Witschey W, Goldberg A, Elliott M, Borthakur A, Reddy R. Magnetization transfer ratio mapping of intervertebral disc degeneration. Magn Reson Med 2010;64(5):1520–1528. [DOI] [PMC free article] [PubMed] [Google Scholar]
Associated Data
This section collects any data citations, data availability statements, or supplementary materials included in this article.


