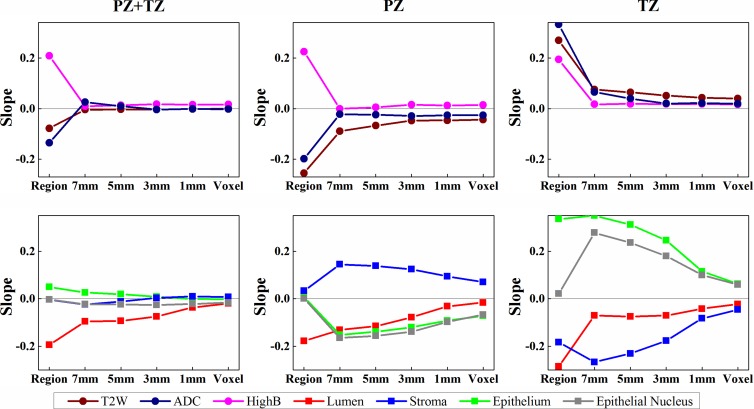
Figure 4:
Graphs show relationship of Gleason score with MR imaging and tissue component density in region- and voxel-based analyses. Slopes of the linear mixed-effects models are computed for MR imaging (top row) and tissue composition (bottom row). Region and voxel denote the slopes for region- and voxel-based analyses, respectively. Increasing the size of a window (1, 3, 5, or 7 mm) yields a stronger association. T2-weighted MR imaging, ADC values, and the density of epithelium and epithelial nucleus show regional differences in association with the Gleason score.

