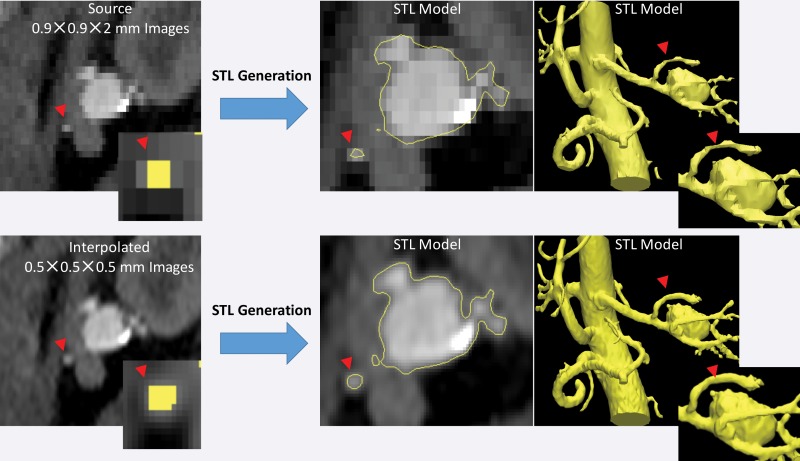
Figure 19.
STL models of a renal aneurysm derived from a CT angiogram. Top: The lumen on the STL model generated from a low–spatial-resolution CT angiogram is blocky and flattened for a small renal artery (arrowheads at top and bottom). The inset (far left) shows the segmented voxels for the artery in the yellow overlay. Bottom: The same CT angiogram interpolated to a higher voxel count (0.5-mm isotropic voxels) without alteration of the image information enables the STL generation algorithm to operate more optimally with identical thresholding segmentation and thus yields a more appropriate model of small arterial lumens.

