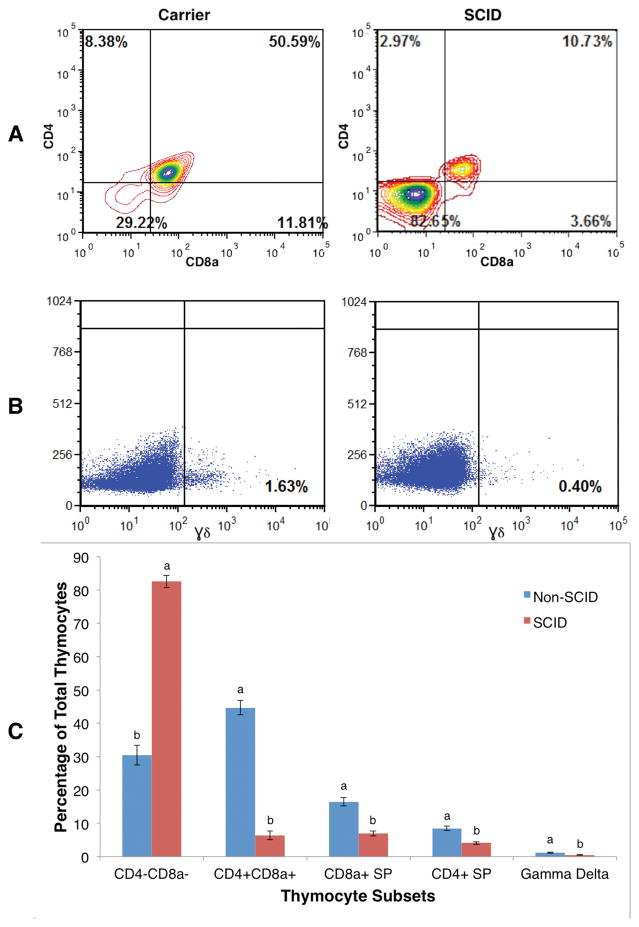
Figure 1. Flow cytometry shows very few CD4+ CD8+ and γδ+ cells in SCID pig thymus.
The number in each diagram is the percentage of each cell type in thymocyte populations of a SCID pig or a non-SCID carrier littermate (panels A and B). CD8a (x-axis) and CD4 (y-axis; panel A) and γδ (panel B) are T-cell surface markers. The least square means of percentages of each thymocyte sub-population are shown in panel C. Error bars represent the standard error of the estimates. Bars with different letters (a and b) indicate statistically significant (p<0.01) differences between SCID and non-SCID expression within cellular subset.

