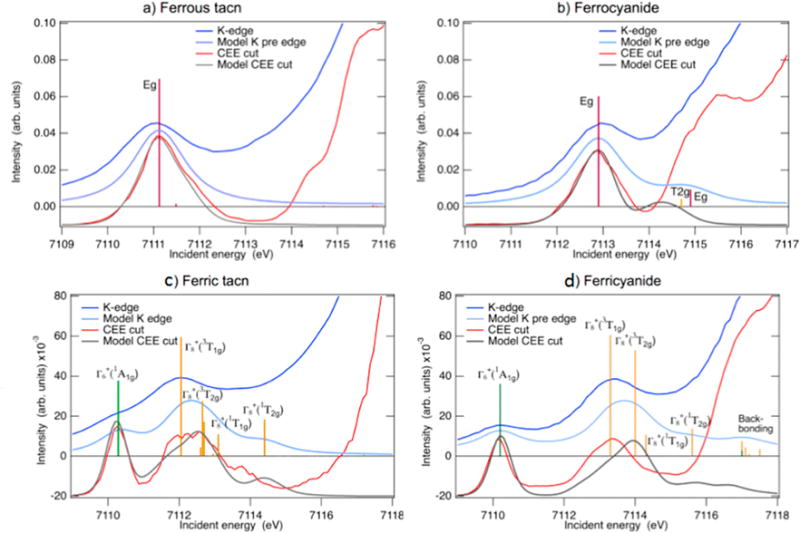
Figure 4.3.

Spectra in the K pre-edge region for ferrous tacn (top left), ferrocyanide (top right), ferric tacn (bottom left), and ferricyanide (bottom right). Experimental K pre-edge spectra (blue) are compared to the spectra from the VBCI multiplet model (light blue). Modeled absorption resonances are shown as sticks. Experimental CEE cuts through the maximum of the pre-edge resonance (red) are compared to the corresponding cuts through the modeled RIXS plane (gray). The CEE cuts are arbitrarily scaled to facilitate comparison with the K pre-edge. Adapted from Ref.[93].
