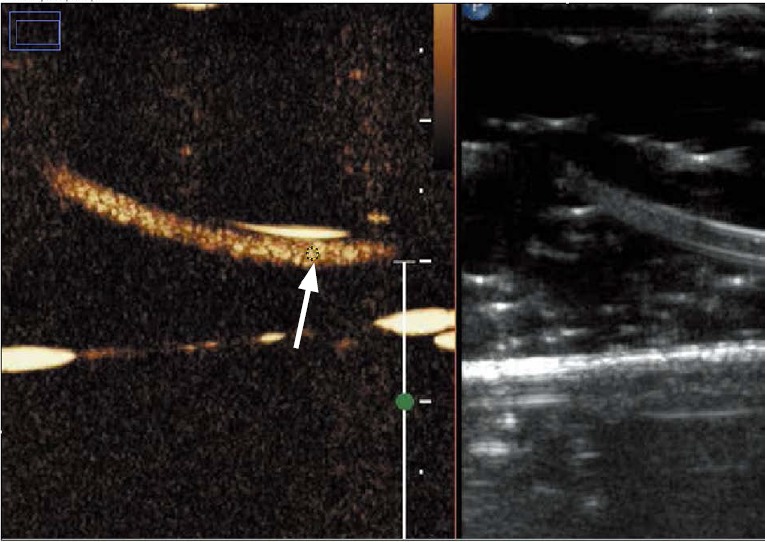
Fig. 5. The method showing how to measure the intensity from the ultrasound images using Image J.

Twenty regions of interest (ROIs) were drawn in each images, the mean and standard deviation of intensities were calculated. Arrow in figure shows one example of ROI located in the tube.
