. 2017 Sep 18;6:e27453. doi: 10.7554/eLife.27453

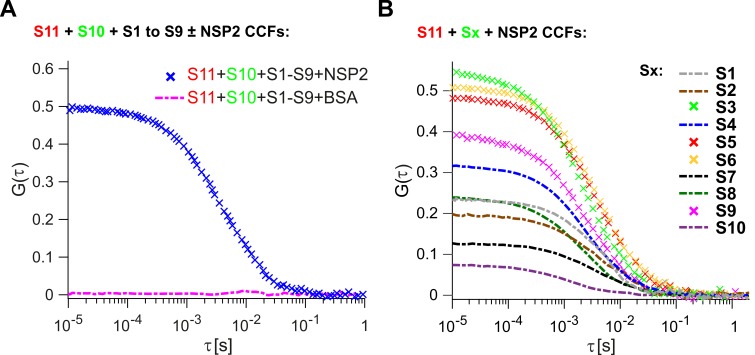
Figure 1. Inter-segment RNA-RNA interactions in rotaviruses examined by FCCS.

(A) Interactions between fluorescently labelled ssRNAs S10 and S11, incubated in the presence of an equimolar set of unlabelled ssRNAs S1 to S9, were probed by FCCS, as described in Materials and methods. A full set of S1-S11 ssRNAs does not associate into a higher order RNA complex (cross-correlation function amplitude, CCF ≈ 0, shown as a dashed magenta line). In contrast, incubation of the mixture of all eleven genomic ssRNAs in the presence of NSP2 results in a strong interaction between S10 and S11 (high amplitude of CCF shown in blue). (B) Pairwise inter-segment RNA-RNA interactions in RVs. Fluorescently labelled ssRNA S11 (red), incubated with RNA Sx (where x – any other genomic ssRNA S1-S10) in the presence of NSP2, as described in Materials and methods. CCF amplitudes were normalised by their respective auto-correlation functions (ACFs), reflecting the differences in the affinities between S11 and other ssRNAs, with the strongest interactions detected for the RNA-RNA combinations S11:S3, S11:S5 and S11:S6.

Figure 1—source data 1. Normalised CCFs of the non-interacting fluorescently labelled ssRNAs S10 and S11, incubated with BSA in the presence of an equimolar set of unlabelled ssRNAs S1 to S9 (CCF = 0), and the CCFs of the interacting S10 and S11 co-incubated with NSP2.
DOI: 10.7554/eLife.27453.010
Figure 1—source data 2. Normalised CCFs of the interacting RNAs S11 and Sx (x – any other RNA S1-S10) in the presence of NSP2.
DOI: 10.7554/eLife.27453.011

Figure 1.

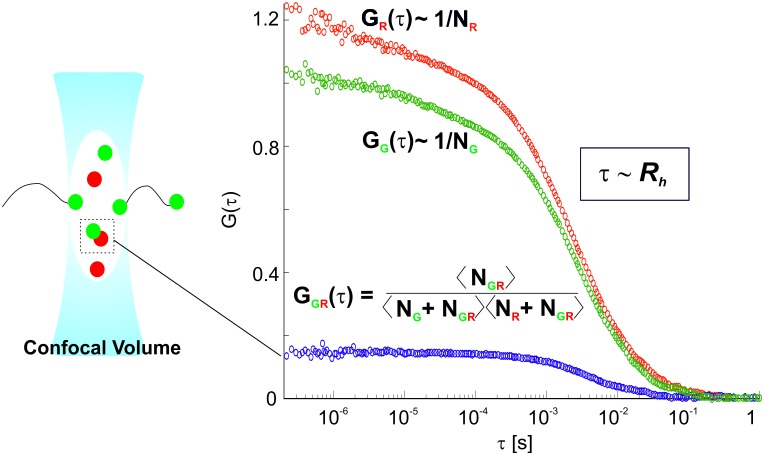
Figure 1—figure supplement 1. Principles of Dual-color Fluorescence Cross-Correlation Spectroscopy (FCCS).

Figure 1—figure supplement 1.

In Fluorescence Correlation Spectroscopy (FCS), the fluorescent signal is collected from fluorescently labelled molecules passing through the confocal volume. This results in fluctuations in the fluorescent signal, which are detected by single photon avalanche photodiodes (APDs). The fluctuations are analyzed using an autocorrelation analysis. Typical autocorrelation functions (ACFs) for the red-labelled RNA S11 (red particles) and green-labelled RNA S5 (green particles) are shown on the right. The diffusion time values, τ, reflect the average dwell times of the labelled molecules, which are proportional to their hydrodynamic radii (Rh), i.e. sizes. The amplitude of the ACF, G(τ), is inversely proportional to the total number (N) of green and red labelled particles, NG and NR respectively. Dual-color Fluorescence Cross-correlation spectroscopy (FCCS) is a powerful extension of FCS technique that detects interactions of two differently labelled molecules. A cross-correlation signal is observed when green- and red-labeled molecules are interacting, thus diffusing together through the detection volume as a single species. This results in a CCF amplitude, GGR(τ), that is directly proportional to the number of the interacting molecules NGR. The fraction of double-labeled species (i.e., interacting RNA molecules) in a sample can be then extracted from the ratio of the amplitudes of the cross-correlation (CCF, shown in blue) to the auto-correlation functions (ACFs, in green and red).
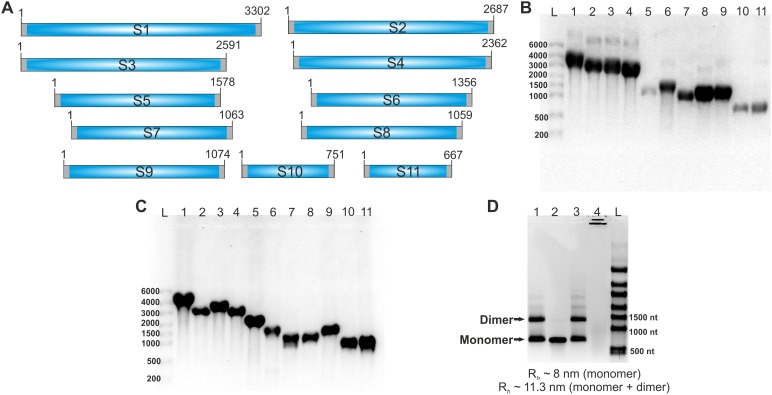
Figure 1—figure supplement 2. RV genomic segment ssRNAs used in the study.

Figure 1—figure supplement 2.

(A) A schematic of eleven positive-sense ssRNAs genome precursors of RVA. Terminal untranslated regions (UTRs) are shown as grey bars. Note that the UTRs are different for different segments: 9–48 nt of the 5’ UTR, and 17–182 nt for the 3’ UTR. For the FCCS assay, RNAs were labelled with either ATTO647 or ATTO565 dyes, as described in Materials and methods. (B) Denaturing formaldehyde agarose gel electrophoresis of 11 ssRNA transcripts. In vitro transcribed RNAs were separated on a formaldehyde agarose gel (1% w/v) and visualized by staining with ethidium bromide. Lanes 1–11 - segment precursors S1-S11. (C) ATTO-dye-labelled RNA transcripts visualised by fluorescence scanning. Lanes 1–11 – segment precursors S1-S11. L – RNA ladder (High Range RiboRuler, Thermo Scientific), sizes shown in number of nucleotides. (D) Mg2+-dependent multimerization of S11 ssRNA. Native (1% agarose, 0.5 x Tris-borate buffer) gel of S11 RNA transcripts prepared and purified as described in Materials and methods. Lane 1 – S11 RNA sample with residual Mg2+ ions after in vitro transcription prior to heat-denaturation. Lane 2 – S11 RNA after heat-annealing (70°C, 5 min, followed by snap-cooling in a low-salt buffer, 10 mM HEPES, pH 7.4). Lane 3 – RNA sample in the presence of 10 mM Mg2+. Lane 4 – RNA sample, heat-annealed in the presence of 10 mM Mg2+ (notable Mg2+-dependent RNA hydrolysis and RNA aggregation). Sizes are given in number of nucleotides, RNA loading concentration – 1 μg/lane. A similar behaviour is also observed in FCS experiments with fluorescently labelled S11 RNA samples. The S11 ssRNA, after heat annealing, has a smaller hydrodynamic radius (Rh ~ 8 nm) compared to non-heat treated RNA (~13 nm). A prolonged incubation of s11 RNA in the presence of 10 mM Mg2+ leads to an increase of Rh, indicating RNA oligomerization.
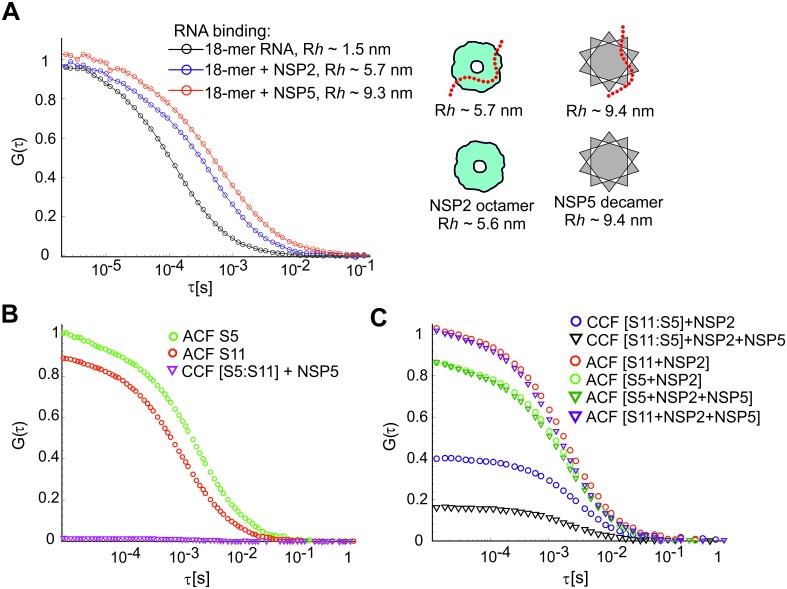
Figure 1—figure supplement 3. RNA-RNA interactions examined by FCCS in the presence of NSP2 and NSP5.

Figure 1—figure supplement 3.

(A) ssRNA-binding of NSP2 and NSP5 to a Cy5-dye labelled 18-nt long ssRNA. Dye-labelled ssRNA probe (1 nM) was incubated with 0.5 μM NSP5 or NSP2, and examined by FCS. Normalised ACFs for the ssRNA alone (black), RNA:NSP2 complex (blue), and RNA:NSP5 (red) are shown along with the respective fits (shown as solid lines, see Materials and methods), yielding the apparent hydrodynamic radii, Rh, shown next to the fits. Sizes of NSP2-bound and NSP5-bound ssRNAs are in close agreement with the previously estimated hydrodynamic radii of NSP2 octamer (Zeng et al., 1998) and NSP5 decamer (Jiang et al., 2006). (B) ssRNA-binding protein NSP5 does not promote interactions between S5 and S11 RNAs. Both fluorescently labelled RNAs were incubated with NSP5 instead of NSP2, and assayed by FCCS, as described above. The resulting CCF ≈ 0 (magenta) indicates lack of detectable interactions between the two RNAs. (C) Co-incubation of NSP2 (20 μM) and 0.5 μM NSP5 with ssRNAs S5 and S11 results in significantly decreased amplitude of CCF (black triangles), compared to the CCF of the S11:S5 RNA complex formed in the presence of NSP2 alone.
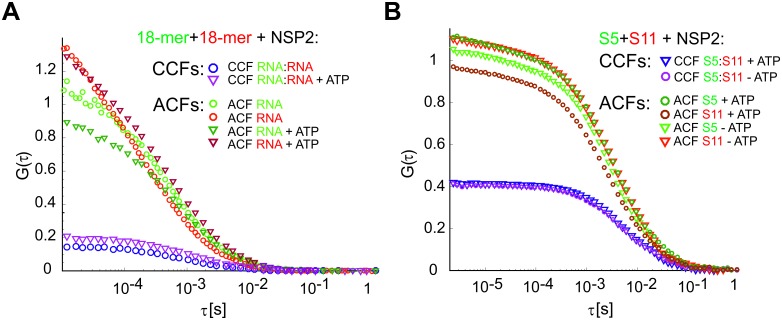
Figure 1—figure supplement 4. Effect of ATP on the RNA-binding properties of NSP2.

Figure 1—figure supplement 4.

(A) RNA-binding properties of NSP2 were examined with two non-complementary Cy5 (red) and Cy3 (green)-labelled ssRNAs (18 nt-long). Non-interacting RNA strands (10 nM each strand) were incubated with 10 nM NSP2 octamer and examined by FCCS. The non-zero CCF (blue circles) suggest that both differently labelled RNAs may bind a single NSP2 octamer with high affinity, consistent with the previously reported binding of two 20-mer RNAs per single NSP2 octamer (Schuck et al., 2001). Addition of 1 mM ATP to the reaction has very little effect on the CCF amplitude (purple triangles). (B) Pairwise S5:S11 interactions assay, as described in Materials and methods, carried out in the presence of 1 mM ATP (CCF shown as blue triangles), and without ATP (CCF shown as purple circles). The resulting CCF amplitudes are similar in both cases, suggesting that addition of 1 mM ATP does not affect the formation of the RNA-RNA contacts.
Figure 1—figure supplement 5. S5:S11 RNA-RNA interactions examined in the presence of RV group A NSP2 mutant ΔC-NSP2 and RV group C NSP2.
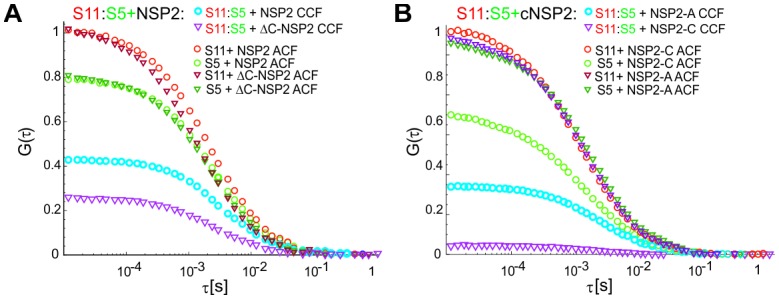
Figure 1—figure supplement 5.

(A) Substitution of a full-length NSP2 with its C-terminally truncated mutantΔC-NSP2 with reduced affinity for ssRNA (see Materials and methods), results in significantly lower efficiency of S5:S11 complex formation (CCF in blue and the reduced CCF in purple). (B) RV group C NSP2 (NSP2-C) was used instead of RV group A NSP2 (NSP2-A) in the RNA-RNA interaction assay as described in (A). The differences in the resulting CCF amplitudes (shown in blue for NSP2-A and in purple for NSP2-C) reveal that NSP2-C has low efficiency in promoting RNA-RNA contacts formation between S5 and S11 ssRNAs.
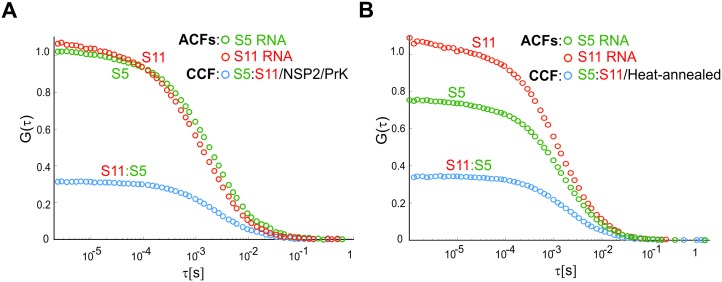
Figure 1—figure supplement 6. Interactions of ssRNAs S5 and S11 after proteolytic removal of NSP2.

Figure 1—figure supplement 6.

(A) Fluorescently labeled S5 (green) and S11 (red) (equimolar ratio, both green and red ACFs ~ 1) were incubated with NSP2 as described in Materials and methods. After incubation, the RNA sample was extensively digested with proteinase K (PrK, see Materials and methods) and then further diluted to 1 nM RNA concentration of each strand. A noticeably longer diffusion time of ATTO565-labelled S5, compared to S11, reflects their differences in sizes (e.g., diffusion times ~ Rh, see Table 1 and Figure 1—figure supplement 2D). After dilution and prolonged incubation in low ionic strength buffer at 37°C, the apparent amplitude of the CCF between S5 and S11 (dark blue) after NSP2 removal is reduced, compared to the NSP2-bound RNA samples (Figure 1B). The non-zero CCF amplitude confirms that the two RNAs remain associated after the removal of NSP2. (B) A control reaction of the heat-annealed fluorescently labelled S5 and S11 RNAs, interacting after heat-annealing, with a CCF amplitude, comparable to the CCF shown in panel (A).