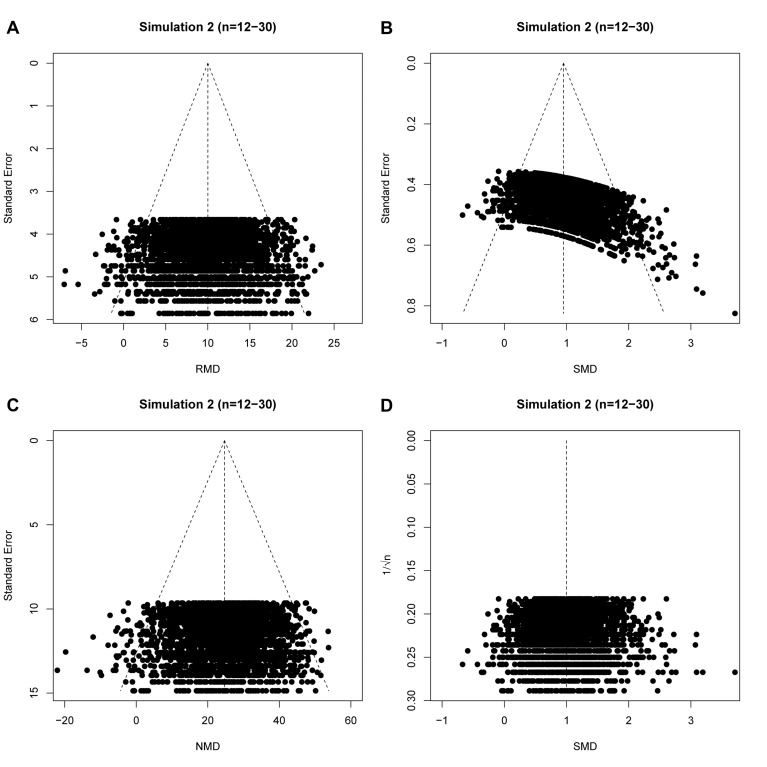
Figure 5. raw mean difference (RMD; A), standardized mean difference (SMD; B), normalized mean difference (NMD; C) with SE as precision estimate, and SMD funnel plots using 1/√n as precision estimate (D).
All plots show the same simulated meta-analysis containing 3000 studies with small sample sizes (n = 12–30) and an overall intervention effect of Δμ = 10. Δμ = difference in normally distributed means between control and intervention group.

