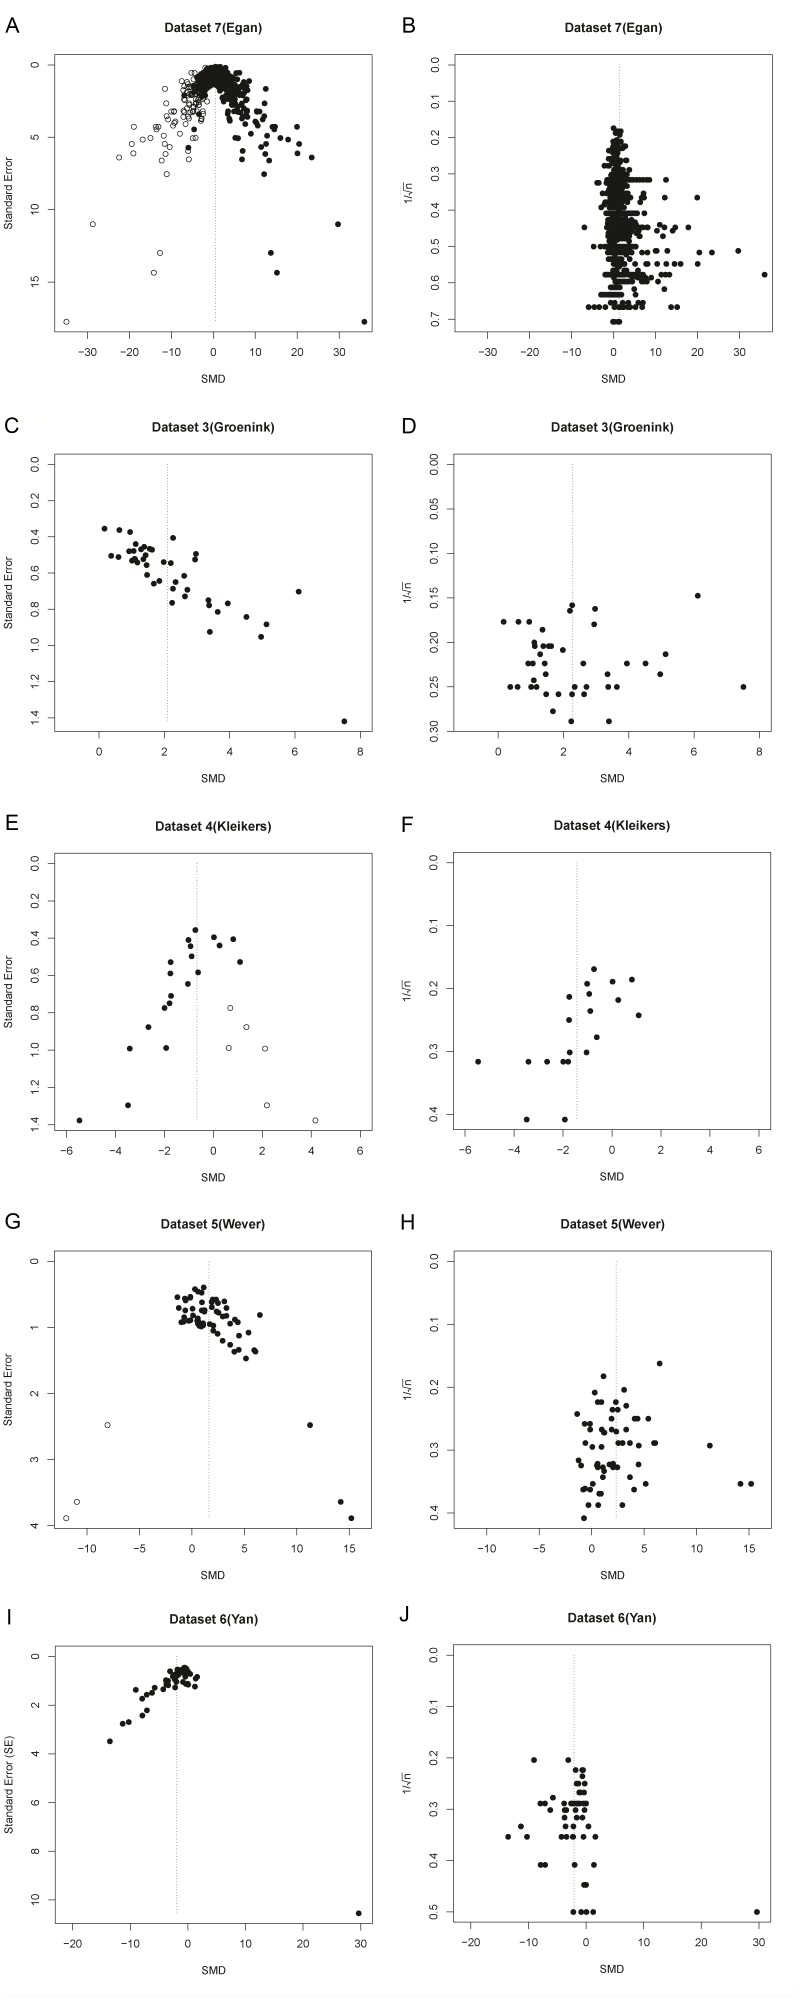
Figure 7. Funnel plots of re-analysis of empirical meta-analyses.
Funnel plots of empirical meta-analyses plotted as standardized mean difference (SMD) versus standard error, as in the original publications (left hand panels), and as SMD versus 1/√n after re-analysis. n = total primary study sample size; filled circles = observed data points; open circles = missing data points as suggested by trim and fill analysis.

