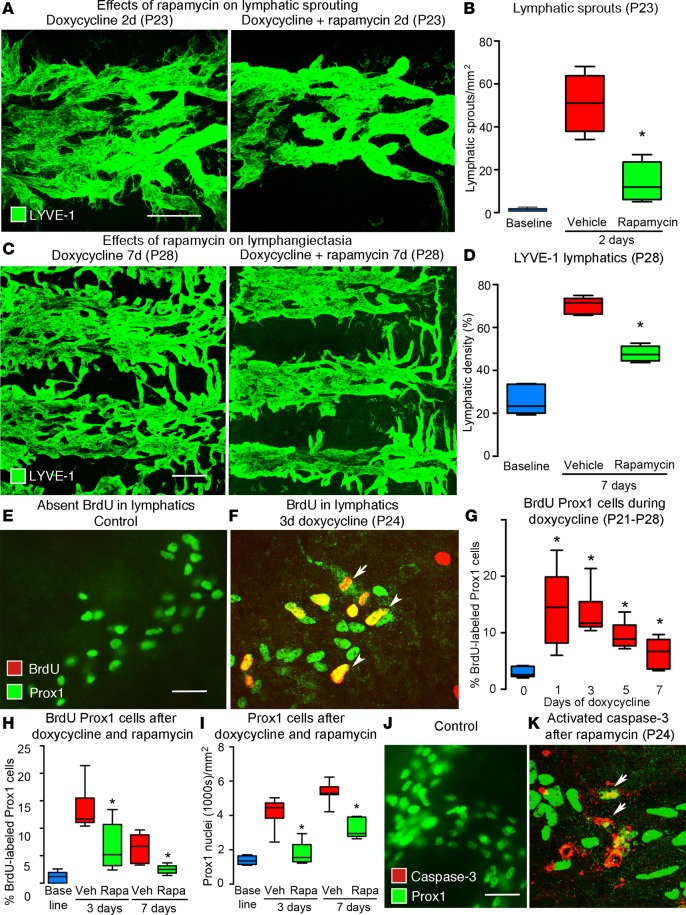
Figure 6. Effect of rapamycin on lymphatic sprouting and proliferation in tracheas of CCSP/VEGF-C mice.
(A) Lymphatic sprouts after doxycycline (left) but not after doxycycline plus rapamycin (right) (2d, P21–P23). (B) Measurements of lymphatic sprouts. Baseline, single-transgenic mice (P21). *P < 0.05 vs. vehicle, ANOVA. (C) Lymphangiogenesis after doxycycline (left) but not after doxycycline plus rapamycin (right) (7d, P21–P28). (D) Measurements of lymphatic density. *P < 0.05 vs. vehicle, ANOVA. (E) No BrdU uptake by lymphatics in control mouse, compared with (F) BrdU-labeled lymphatics (arrowheads) after doxycycline (3d). Dividing lymphatic endothelial cell (arrow). (G) BrdU labeling of lymphatics after doxycycline for 1–7 days (P21–P28). *P < 0.05 vs. baseline, ANOVA. (H) Rapamycin suppression of BrdU labeling after doxycycline for 3 or 7 days (P24 or P28), expressed as a percentage of Prox1-positive cells. (I) Reduction in Prox1-positive cells after doxycycline plus rapamycin for 3 days (87% reduction, P24) or 7 days (52% reduction, P28). (J) No activated caspase-3 staining in control lymphatics, compared with (K) staining of fragmented Prox1-positive cells (arrows) after doxycycline plus rapamycin (3d, P21 to P24). n = 5 mice/group. Scale bar: 100 μm (A); 200 μm (C); 20 μm (E, F, J, and K). Box and whisker plots show the median, first and third quartiles, and maximum and minimum.

