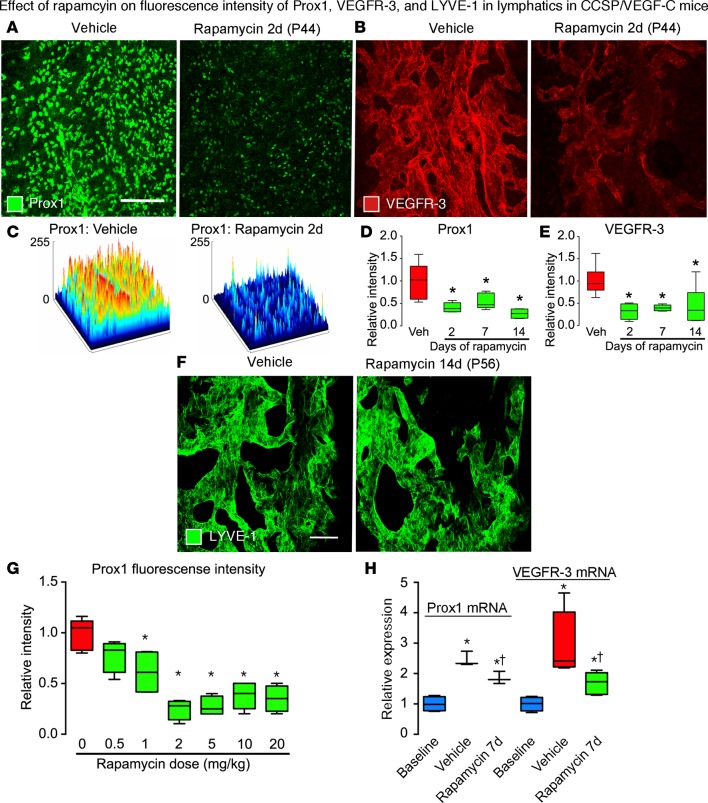
Figure 8. Effects of rapamycin on Prox1, VEGFR-3, and LYVE-1 in lymphatics of CCSP/VEGF-C mice.
(A and B) Confocal micrographs comparing Prox1 (A) and VEGFR-3 (B) immunofluorescence in tracheas of CCSP/VEGF-C mice treated with vehicle or rapamycin (2 days, P42–P44). Images photographed with matching brightness and contrast settings. (C) Surface contour plots of intensity of Prox1 fluorescence in A after treatment with vehicle or rapamycin. Prox1 (D) and VEGFR-3 (E) fluorescence intensities in CCSP/VEGF-C mice treated, as in A and B. (F) Confocal micrographs of LYVE-1 immunofluorescence in tracheas of CCSP/VEGF-C mice, showing no difference in intensity after treatment with vehicle or rapamycin (14 days, P42–P56). (G) Rapamycin dose-response effect on Prox1 fluorescence intensity. *P < 0.05 vs. vehicle, ANOVA, n = 4–6 mice/group. (H) qRT-PCR measurements of Prox1 and VEGFR-3 expression in tracheas of CCSP/VEGF-C mice on vehicle or rapamycin (7 days, P42–P49). *P < 0.05 vs. baseline, †P < 0.05 vs. vehicle, ANOVA, n = 3–6 mice/group. Scale bars: 200 μm (A and B); 50 μm (F). Box and whisker plots show the median, first and third quartiles, and maximum and minimum.

