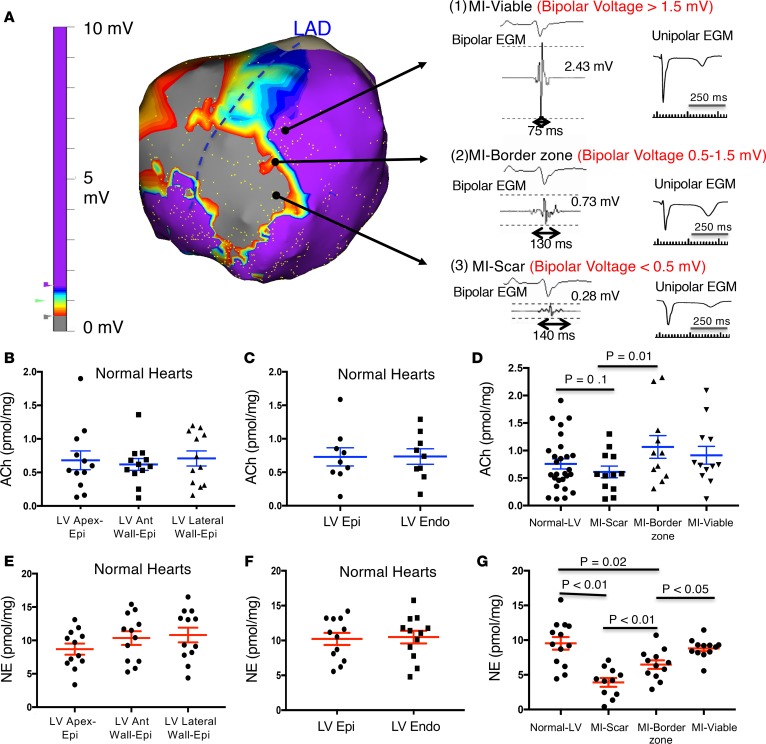
Figure 1. Cardiac voltage mapping and neurotransmitter analysis.
(A) Bipolar voltage electroanatomic maps of infarcted hearts were obtained and used to identify viable, border zone, and scar regions. Examples of bipolar electrical recordings from viable, border zone, and scar regions are shown. Examples of uinpolar electrograms obtained from similar regions are also shown. This map and bipolar voltage measurements were used to obtain samples for neurotransmitter analysis from appropriate locations. The scale bar shows the voltage from 0–10 mV. (B) In normal hearts (n = 12 normal animals, 3 samples per animal), acetylcholine (ACh) levels were not significantly different on the LV apex, anterior, lateral walls (linear mixed effects model). (C) ACh levels from paired LV epicardium and endocardium samples were also not significantly different (n = 9 normal animals, 2–3 samples per animal). (D) In infarcted hearts (n = 14), scar regions have the lowest ACh content compared with viable and border zone regions (P < 0.01, linear mixed effects model, 1–3 samples per region per animal). However, ACh content between viable and border zone regions of infarcted animals (n = 14) compared with similar regions of normal hearts (n = 15 animals) was not statistically significant (P = 0.4, linear mixed effects model). There is a suggestion that scar ACh may be somewhat reduced compared with normal hearts; however, this difference did not reach statistical significance. (E) Similar to ACh levels, there was no difference in norepinephrine (NE) content across the LV apex, anterior, or lateral wall (linear mixed effects model, n = 12 normal animals, 3 samples per animal). (F) Also, similar to ACh, NE levels in the endocardium were similar to epicardium (linear mixed effects model, n = 9 animals, 2–3 samples per animal). (G) Unlike ACh, the NE content in scar and border zone regions was significantly reduced compared with viable myocardium in infarcted hearts (P < 0.05 for border zone vs. viable, and P < 0.01 for scar vs. viable, linear mixed effects model, n = 5 animals, 1–3 samples per region per animal) and was significantly less than similar regions in normal hearts (P < 0.01, linear mixed effects model). There was no difference in NE content of viable regions of infarcted hearts compared with normal hearts. MI, myocardial infarction; EGM, myocardial electrogram; LV, left ventricle; Epi, epicardium; Endo, endocardium.

