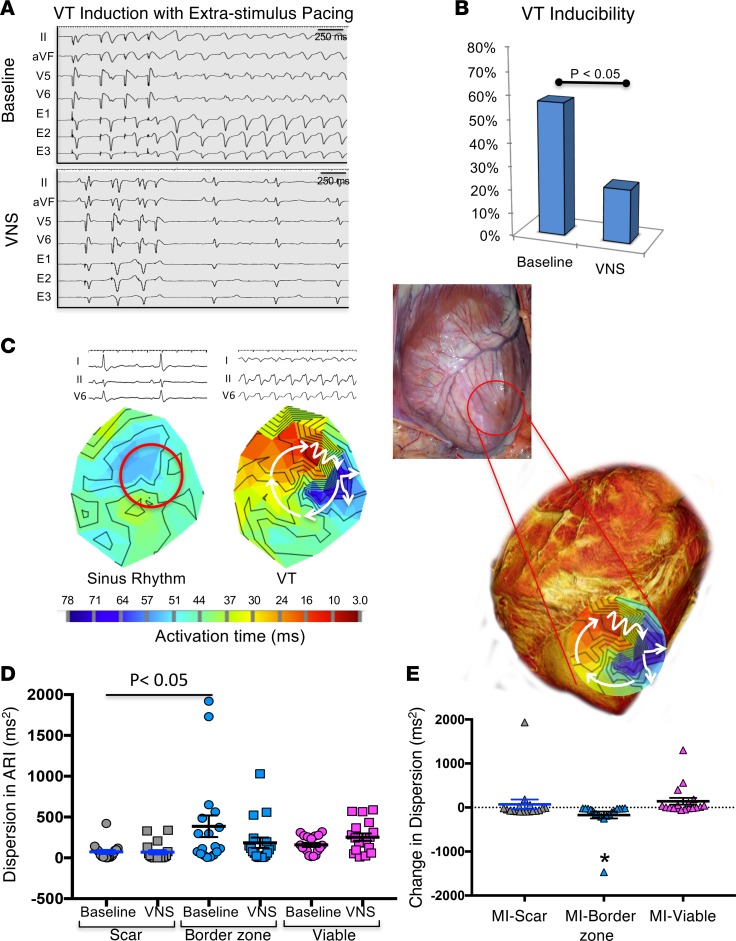
Figure 6. Arrhythmia inducibility and dispersion of repolarization.
(A) An example of VT/VF induction using extrastimulus pacing from the RV endocardium is shown. Prior to VNS, this infarcted animal was inducible for VT, which degenerated into VF and required defibrillation. During intermittent VNS, VT/VF was no longer inducible with triple extrastimuli, and effective refractory period was reached. (B) Intermittent VNS significantly reduced the proportion of animals that were inducible for VT (n = 21 infarcted, P = 0.04, McNemar’s test). (C) Epicardial activation map during VT in an infarcted animal that was inducible at baseline shows significant area of slowed conduction (multiple contours, zig-zag arrow) with “early” activation meeting “late activation” along the anterolateral border zone, likely contributing to reentry. (D) The dispersion in ARI at baseline and during VNS is shown across scar, border zone, and viable regions in infarcted hearts. Regional analysis showed that the dispersion in ARI in border zone regions was greater than scar regions (P < 0.05, linear mixed effects model, n = 18 infarcted animals) at baseline. (E) Intermittent VNS significantly reduced the dispersion in ARI of border zone regions compared with scar and viable areas (*P < 0.01, linear mixed effects model, n = 18 infarcted animals). ARI, activation recovery interval; MI, myocardial infarction; VNS, vagal nerve stimulation; VT, ventricular tachyarrhythmia.

