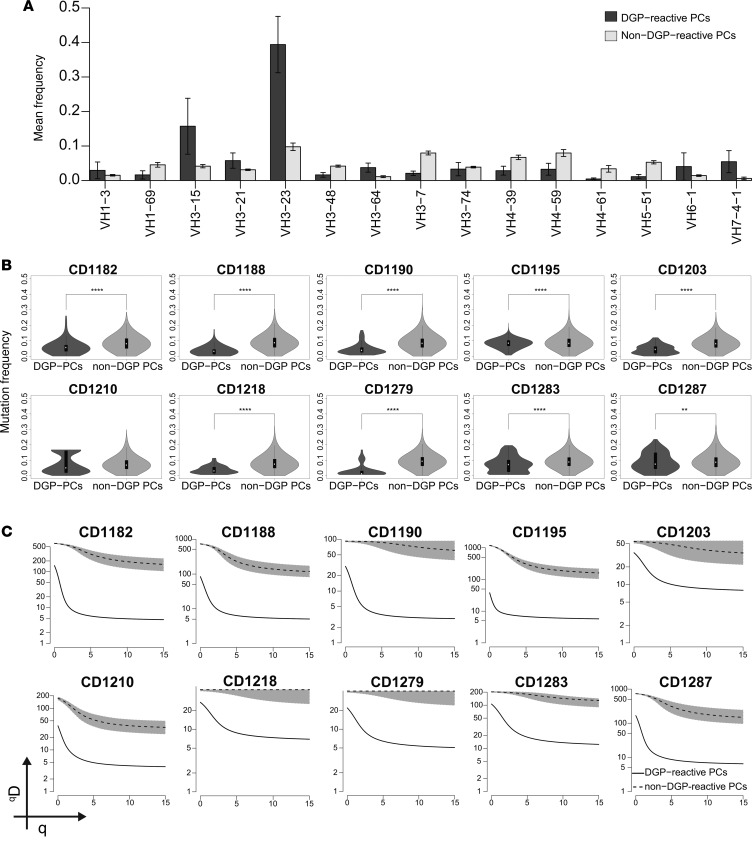
Figure 1. IGHV repertoire, frequency of somatic mutation, and clonal diversity of DGP-reactive PCs.
(A) Bars represent the mean frequencies ± SD of the most abundantly expressed IGHV gene segments by DGP-reactive PCs and non–DGP-reactive PCs in 10 CD patients with active disease. (B) Mutation frequency in the IGHV genes of non–DGP-reactive and DGP-reactive PCs from 10 CD patients. White dots indicate the median frequency of mutation with 1.5 interquartile range. The differences between DGP-reactive PCs and non–DGP-reactive PCs were assessed by 2-tailed Student’s t test (**P < 0.01 and ****P < 0.0001). (C) Diversity and clonal size distribution of DGP-reactive and non–DGP-reactive PCs as measured by Hill’s diversity index. qD values depict the level of diversity for a given value of q; lower qD values represent lower diversity. Shaded area represents 95% percentiles.

