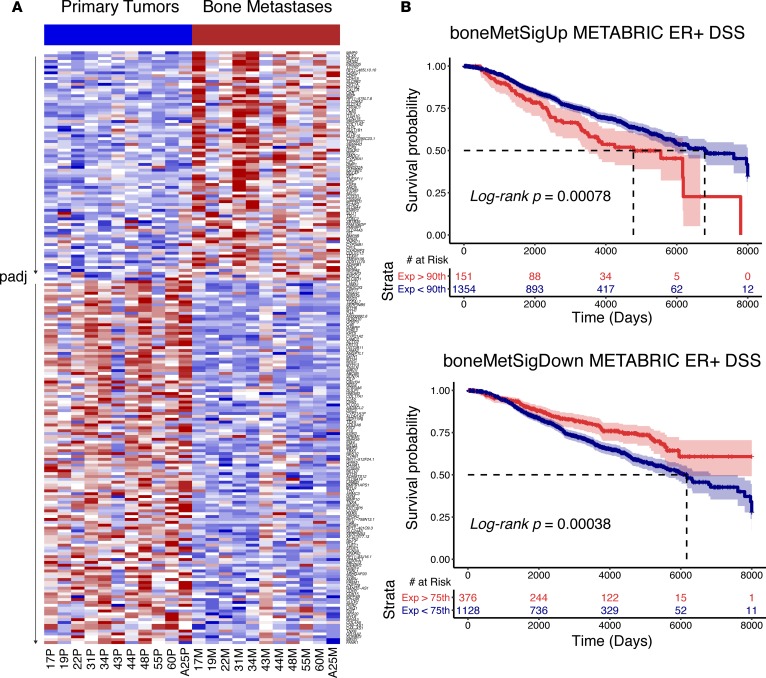
Figure 3. Differentially expressed genes in patient-matched bone metastases.
(A) Heatmap (red, high relative expression; blue, low relative expression) of log2normCPM values from 207 differentially expressed genes (FDR-adjusted P value [padj] < 0.10, DESeq2) between primary tumors and patient-matched bone metastases. Heatmap is segregated into two sections; genes with log2 fold change >0 on top and genes with log2 fold change <0 on bottom. Each section is gene sorted by adjusted P values. (B) Disease-specific survival (DSS) outcome differences in ER-positive METABRIC tumors using boneMetSigUp (top) and boneMetSigDown (bottom) expression scores as strata. 95% confidence intervals are highlighted along with log-rank P values and associated risk tables.

