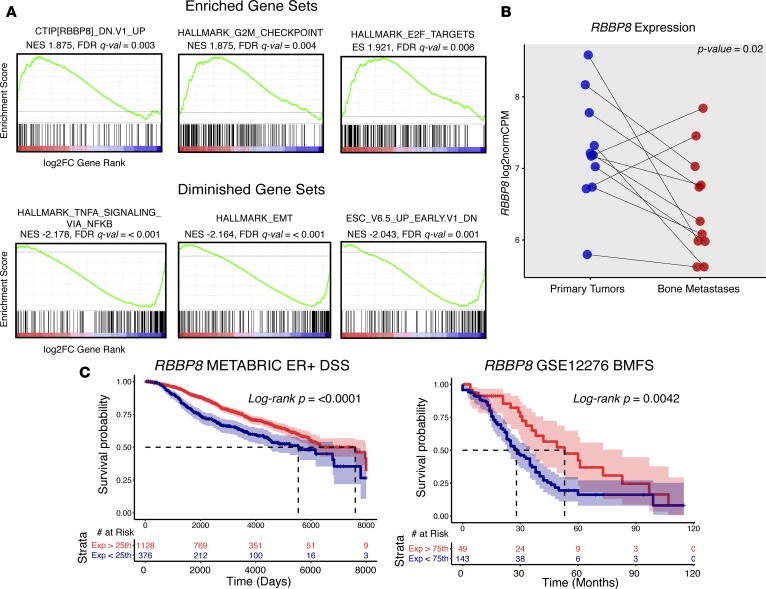
Figure 4. Dysregulated gene sets and RBBP8 loss in breast cancer bone metastases.
(A) Top three enriched and depleted gene sets (by FDR q value) in bone metastases from ranked GSEA analysis (n = 11 pairs). Gene list ranking was performed using log2 fold change values from DESeq2 differential expression output, where a positive log2 fold change represents increased expression in metastasis (red) and a negative log2 fold change represents decreased expression in metastasis (blue). Green lines show running enrichment scores. Black vertical lines below curve show where genes within the query gene set are represented in the ranked list. Normalized enrichment score (NES) and FDR q values (derived from GSEA tool) are noted below gene set names. (B) RBBP8 expression values (log2normCPMs) in primary tumors (blue) and bone metastasis (red). Pairs are connected with a line and Wilcoxon signed-rank P value is shown. (C) Disease-specific survival (DSS) outcome differences in ER-positive tumors (METABRIC) and bone metastasis–free survival (BMFS) differences (GSE12276) using normalized RBBP8 expression values as strata. 95% confidence intervals are highlighted along with log-rank P values and risk tables.

