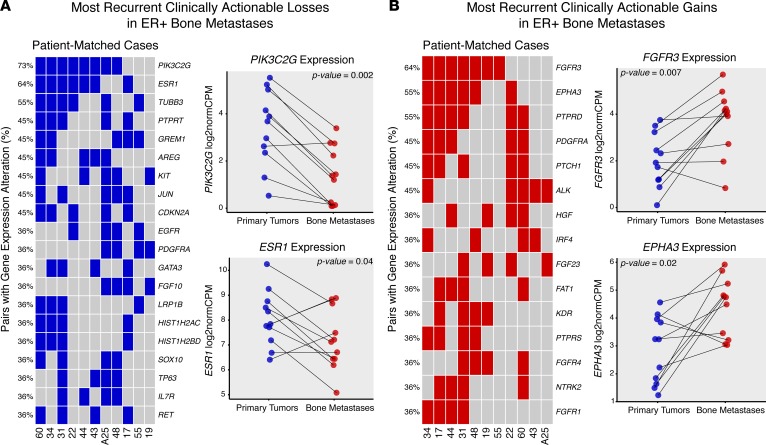
Figure 5. Recurrent, clinically actionable expression gains and losses in ER-positive bone metastasis.
(A) Recurrent expression alteration losses, ranked by frequency, for each patient-matched case (columns, n = 11 cases). Each blue tile represents a bone metastasis with a lower log2 fold change vs. its matched primary than the case-specific expression loss threshold. Expression values (log2normCPMs) for most recurrent losses (PIK3C2G, ESR1) are pair plotted, with corresponding Wilcoxon signed-rank test P values noted. (B) Recurrent expression alteration gains, ranked by frequency. Red tiles represent bone metastases with higher log2 fold change than the case-specific expression gain thresholds. The two most recurrent expression gains (FGFR3, EPHA3) are also plotted with Wilcoxon signed-rank test P values.

